
Fig. 8
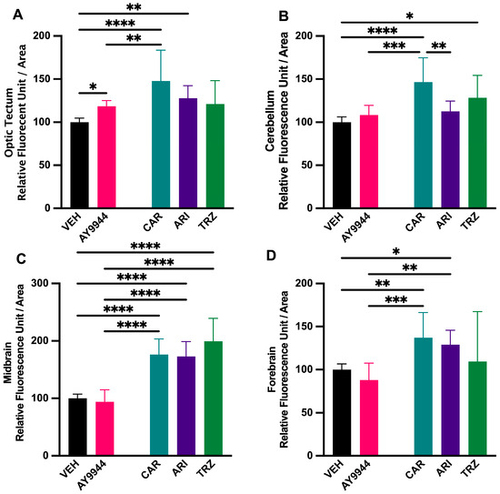
(A–D) Neuronal density in developing brain regions of zebrafish following AY9944 and psychopharmaceutical exposure. HuC/D immunohistochemistry is used to measure fluorescent intensity and evaluate neuronal density in the optic tectum (A), cerebellum (B), midbrain (C), and forebrain (D) in VEH and AY9944 exposed zebrafish compared to CAR, ARI, and TRZ exposed zebrafish. N ≥ 4 and 4 areas per brain region were measured/zebrafish. * p < 0.05, ** p < 0.01, *** p < 0.001, **** p < 0.0001, determined by one-way ANOVA followed by Tukey’s post hoc HSD. VEH = 0.1% DMSO, AY9944 = positive control, CAR = Cariprazine, ARI = Aripiprazole, TRZ = Trazodone. Error Bars = 95% confidence intervals. |