
Fig. 6
- ID
- ZDB-FIG-250807-56
- Publication
- Lush et al., 2025 - Stem and progenitor cell proliferation are independently regulated by cell type-specific cyclinD genes
- Other Figures
- All Figure Page
- Back to All Figure Page
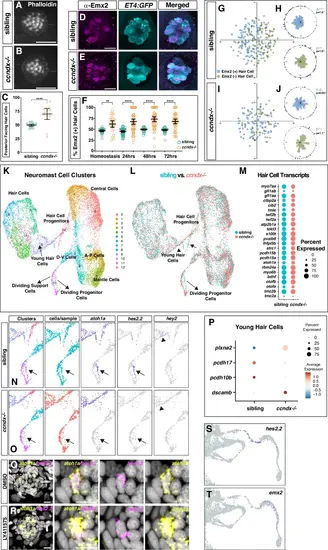
scRNA-seq of 5 dpf ccndx−/− neuromasts.Phalloidin staining of sibling (A) and ccndx−/− (B) 5 dpf neuromasts. Scale bar = 10 µm. C Quantification of posterior-polarized hair cells per neuromast. Data are presented as mean values + /− 95% confidence intervals. ****p < 0.0001, two-tailed t-test. n = 18 for sibling and n = 15 for ccndx−/−. Anti-Emx2 immunostaining (magenta) in 5 dpf sqEt4:EGFP (cyan) expressing sibling D and ccndx−/− neuromasts (E). Scale bar = 10 µm. F Quantification of the percentage of anti-Emx2+ hair cells per neuromast during homeostasis and at 24, 48 or 72 h after neomycin treatment. Data are presented as mean values + /− 95% confidence intervals. **p = 0.006, ****p < 0.0001, Two-way Anova (genotype, condition) with Šidák multiple comparisons test. n = 30, n = 60, n = 55 and n = 58 for sibling at homeostasis, 24, 48 or 72 hpf respectively, n = 25, n = 61, n = 54 and n = 47 for ccndx−/− at homeostasis, 24, 48 or 72 hpf respectively. G–J Spatial analysis of Emx2+ or Emx2- hair cell nuclei cell position in sibling (G-H) and ccndx−/− (I-J) 72 h post neomycin treatment. H, J One-sided binomial analysis of Emx2+ hair cell positions, n = 18 for each group. K UMAP plot of integrated scRNA-seq datasets of 5 dpf sibling and ccndx−/− lateral line cells with neuromast cell types labeled. L Same UMAP plot as in (K) with sibling cells (cyan) or ccndx−/− cells (red) individually labeled showing a reduction in the number of dividing progenitor cells (arrows) in ccndx−/− larvae. M Dot plot showing percentage of hair cells that express a given known hair cell gene comparing sibling (cyan) and ccndx−/− (red) mature hair cell populations. Magnifications of scRNA-seq UMAP and Feature Plots of differentiating progenitor cells and young hair cells. Individual Feature Plots for atoh1a, hes2.2, and hey2 in sibling (N) and ccndx−/− (O). atoh1a is expressed in progenitor cells and young hair cells. hes2.2 is expressed in a subset of progenitor cells and is greatly reduced in ccndx−/− cells. hey2 expression in young hair cells is reduced in ccndx−/−. P Dot plot of mRNA expression levels of a subset of differentially expressed genes comparing sibling and ccndx−/− young hair cell populations. HCR for atoh1a (yellow) and hes2.2 (magenta) in a 5 dpf neuromast after DMSO (Q) or LY411575 (R) treatment showing co-expression within an individual progenitor cell. With cropped views of a single double-positive cell. Scale bar = 10 µm. Cropped image of hes2.2 Feature Plot from scRNA-Seq regenerating time-course from Baek et al.,202212 in progenitor cells (S) before emx2 expression (T) in young hair cells. Scale bar = 10 µm. |