
Fig. 1
- ID
- ZDB-FIG-250807-51
- Publication
- Lush et al., 2025 - Stem and progenitor cell proliferation are independently regulated by cell type-specific cyclinD genes
- Other Figures
- All Figure Page
- Back to All Figure Page
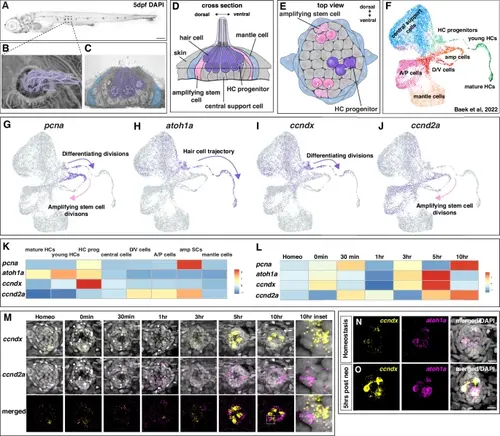
ccndx and ccnd2a are dynamically expressed in different proliferating cells in the regenerating zebrafish lateral line. A Representative image of a 5 dpf DAPI-stained zebrafish larva, posterior lateral line neuromast in boxed region. Scale bar = 200 µm. B Scanning electron micrograph of a 5 dpf zebrafish neuromast (dorsal view) with short stereocilia and long kinocilia in purple (adapted from Lush, M.E. and Piotrowski, T. (2014), Sensory hair cell regeneration in the zebrafish lateral line. Dev. Dyn., 243: 1187-1202. https://doi.org/10.1002/dvdy.24167”10). C Transmission electron micrograph of a transverse section of a 5 dpf neuromast with hair cells in purple and mantle cells in blue. Additional support cells are unlabeled (adapted from Lush, M.E. and Piotrowski, T. (2014), Sensory hair cell regeneration in the zebrafish lateral line. Dev. Dyn., 243: 1187-1202. https://doi.org/10.1002/dvdy.24167”10). Diagram of a neuromast showing a transverse section (D) and a dorsal view (E). Progenitor cells and hair cells are in purple, amplifying stem cells in the dorsal-ventral poles in pink and mantle cells in blue. F Integrated scRNA-seq UMAP plot of a neuromast regeneration time course (homeostasis, 0 min, 30 min, 1 h, 3 h, 5 h and 10 h after hair cell death; Baek et al., 202212). G–J scRNA-seq Feature Plots (Baek et al., 202212,https://piotrowskilab.shinyapps.io/neuromast_regeneration_scRNAseq_pub_2021/) illustrating gene-specific expression patterns. G pcna labels dividing, differentiating hair cell progenitors (purple arrow) and amplifying stem cells (pink arrow). H atoh1a is expressed in some central cells and marks the lineage from hair cell progenitors to hair cells (purple arrow). I ccndx is expressed in some central cells and along the hair cell lineage and is highest in progenitor cells undergoing differentiating divisions (purple arrow). J ccnd2a is more broadly expressed but is highest in the amplifying cell population (pink arrow) and absent from the hair cell lineage. K Heatmap of scaled gene expression across lateral line cell types during the averaged regeneration time course (Baek et al., 202212). L Heatmap of scaled gene expression during the regeneration time course. All genes are briefly upregulated at 0–30 min but show the largest activation between 3 − 10 h. atoh1a and ccndx show similar expression dynamics, whereas ccnd2a expression peaks slightly later. M Representative images of HCR in situ hybridization of ccndx (yellow) and ccnd2a (magenta) during the regeneration time course. Scale bar = 10 µm. Representative images of HCR in situ hybridization of ccndx (yellow) and atoh1a (magenta) during homeostasis (N) and 5 h after hair cell death (O). Scale bar = 10 µm. |