
Fig. 2
- ID
- ZDB-FIG-250807-52
- Publication
- Lush et al., 2025 - Stem and progenitor cell proliferation are independently regulated by cell type-specific cyclinD genes
- Other Figures
- All Figure Page
- Back to All Figure Page
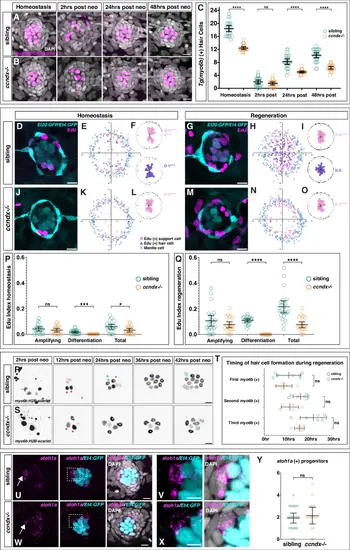
In ccndx mutants hair cells regenerate through direct differentiation in the absence of proliferation.Time course of hair cell regeneration in sibling (A) and ccndx−/− (B) at homeostasis and 2, 24 or 48 h after hair cell death. Hair cells are labeled by myo6b:H2B-mScarlet-I (magenta). Scale bar = 10 µm. C Hair cell counts in sibling and ccndx−/− at homeostasis and 2, 24 or 48 hrs after hair cell death. Circles represent individual neuromasts. Data are presented as mean values + /− 95% confidence intervals. n = 24 for all. ns = not significant p = 0.99, ****p < 0.0001, Two-way Anova (genotype, condition) with Šidák multiple comparisons test. D–F Sibling neuromast expressing sqEt4:GFP/sqEt20:GFP stained with EdU (magenta) after 5 − 6 dpf of homeostasis (D). Scale bar = 10 µm. Spatial analysis of multiple neuromasts showing EdU+ support cells (pink squares), EdU+ hair cells (purple triangles) and surrounding mantle cells (blue X’s, (E). F One-sided binomial analysis of position of EdU+ support cells (pink) and hair cells (purple). ****p < 0.00001, ***p < 0.0001. n = 21. Sibling neuromast 24 h after neomycin treatment expressing sqEt4:GFP/sqEt20:GFP and labeled with EdU (magenta) (G). Scale bar = 10 µm. Spatial analysis of multiple sibling regenerating neuromasts (H) and one-sided binomial analysis of EdU+ cell positions (I). **** p < 0.00001, ns = not significant, p = 0.27. n = 24. J–L ccndx−/− neuromast expressing sqEt4:GFP/sqEt20:GFP labeled with EdU (magenta) after 5 − 6 dpf of homeostasis (J). Scale bar = 10 µm. Spatial analysis of multiple ccndx−/− homeostatic neuromasts (K) and one-sided binomial analysis of EdU+ cell positions, ****p < 0.00001 (L). No EdU+ hair cells are present. n = 21. M–O ccndx−/− neuromast 24 hrs after neomycin treatment expressing sqEt4:GFP/sqEt20:GFP and labeled with EdU (magenta) (M). Scale bar = 10 µm. Spatial analysis of multiple ccndx−/− regenerating neuromasts (N) and one-sided binomial analysis of EdU+ cell positions, ****p < 0.00001 (O). No EdU+ hair cells are present. n = 23. P EdU indexes of sibling and ccndx−/− amplifying, differentiation or total EdU+ cells during homeostasis. Data are presented as mean values + /− 95% confidence intervals. N = 21 for sibling and ccndx−/−. ns = not significant p = 0.35, ***p = 0.0001, *p = 0.0223, two-tailed t-test. (Q) EdU indexes of sibling and ccndx−/− amplifying, differentiation and total EdU+ cells after 24 hrs of regeneration. Data are presented as mean values + /− 95% confidence intervals. n = 24 for sibling and n = 23 for ccndx−/−. ns = not significant p = 0.19, ****p < 0.0001, two-tailed t-test. R Time-lapse analysis of regenerating sibling myo6b:H2B-mScarlet-I+ hair cells from 2 to 42 h after neomycin treatment. Red triangles point to hair cells that survived neomycin. Each new pair of hair cells is marked by differently colored dots. Scale bar = 10 µm. S Time-lapse analysis of regenerating ccndx−/− hair cells from 2 to 42 h after neomycin treatment. Red triangles point to hair cells that survived neomycin. Each new hair cell is marked by differently colored dots. T Quantification of the appearance of the first, second and third hair cell in sibling and ccndx−/− neuromasts over 30 h of regeneration. For siblings, the appearance of each new cell before division was counted. Data are presented as mean values + /− 95% confidence intervals. n = 7 for sibling and n = 6 for ccndx−/−. ns = not significant, p = 1 for first, p = 0.29 for second and p = 0.62 for third myo6b(+) cells, Two-way Anova (genotype, time) with Šidák multiple comparisons test. U atoh1a HCR (magenta) and sqEt4:GFP+ (cyan) hair cells in 5 dpf sibling neuromasts. V A magnified atoh1a+/sqET4:GFP- progenitor cell from (U). Scale bar = 10 µm. W, X atoh1a HCR (magenta) and sqEt4:GFP+ (cyan) hair cells in 5 dpf ccndx−/− neuromasts. X A magnified atoh1a+/sqET4:GFP- progenitor cell from (W). Scale bar = 10 µm. Y Quantification of 5 dpf atoh1a+/sqET4:GFP − progenitor cells showing no difference between sibling and ccndx−/−. Data are presented as mean values + /− 95% confidence intervals. n = 23 for sibling and n = 15 for ccndx−/−. ns = not significant, p = 0.575, two-tailed t-test. |