
Fig. 4
- ID
- ZDB-FIG-250807-54
- Publication
- Lush et al., 2025 - Stem and progenitor cell proliferation are independently regulated by cell type-specific cyclinD genes
- Other Figures
- All Figure Page
- Back to All Figure Page
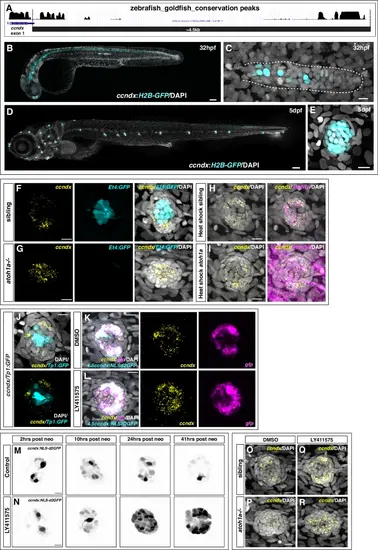
Characterization of ccndx enhancer regions and negative regulation of ccndx expression by Notch signaling.A UCSC zebrafish genome browser track showing two regions of conservation with the goldfish genome upstream of ccndx exon 1. The black bar indicates the 4.5 kb region cloned. B, C DAPI stained 32 hpf zebrafish larvae showing H2B-EGFP (cyan) expression in the hindbrain, spinal cord and migrating lateral line primordium driven by the ccndx upstream region with a higher magnification image of the primordium (C). Scale bars = 10 µm and 200 µm, respectively. D, E DAPI stained 5 dpf zebrafish showing H2B-EGFP (cyan) expression in the spinal cord and neuromasts driven by the ccndx upstream region with higher magnification view of a neuromast from a different larva (E). Scale bars =10 µm and 200 µm, respectively. ccndx HCR (yellow) in 5 dpf sibling (F) or atoh1a−/− neuromasts (G). sqEt4:EGFP expression (cyan) shows lack of hair cells in atoh1a−/− larvae. ccndx is expressed in atoh1a−/− neuromasts and shows a broader and more central expression pattern. Scale bar = 10 µm. HCR for ccndx (yellow) and atoh1a (magenta) in heat shocked sibling (H) and hs:atoh1a larvae (I). Scale bar = 10 µm. J ccndx HCR (yellow) in zebrafish expressing the tp1bglobin:egfp Notch reporter (cyan) showing the lack of co-localization. Scale bar = 10 µm. HCR for ccndx (yellow) and egfp (magenta) in ccndx:NLS-d2GFP (cyan) transgenic zebrafish treated with DMSO (K) or LY411575 (L) for 6 hrs. LY411575 treatment induces an increase in ccndx and egfp expression, especially in the central region. Scale bar = 10 µm.Maximum projection still images from time lapses of ccndx:NLS-d2EGFP transgenic zebrafish which were treated with DMSO (M) or LY411575 (N) immediately after neomycin treatment. There is an increase in the number of NLS-d2EGFP+ cells around 10 h after neomycin which decreases in DMSO treated fish but continues to increase with Notch inhibition. Scale bar = 10 µm. HCR for ccndx (yellow) in 5 dpf neuromasts in DMSO treated sibling (O) or atoh1a−/− (P) or LY411575 treated sibling (Q) or atoh1a−/− (R). Scale bar = 10 µm. |