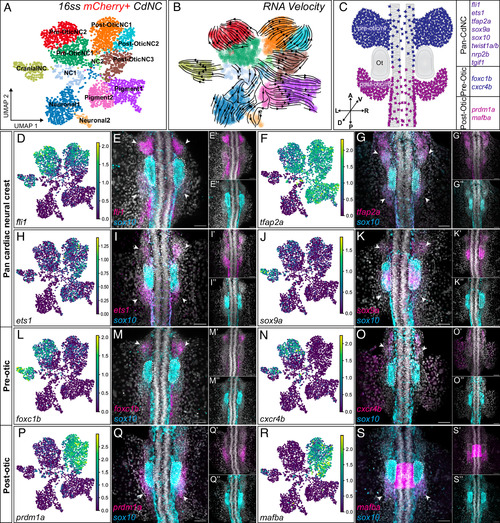
Single-cell analysis reveals two transcriptionally distinct populations of CdNC. (A) Labeled leiden clustering UMAP of scRNA sequencing of FAC sorted mCherry+ CdNC cells. (B) RNA velocity embedded on UMAP. (C) Illustration of a dorsal view, 16ss zebrafish embryo with pre- and postotic CdNC domains labeled and validated genes listed that are restricted to either domain or shared among both domains. (D–S″) UMAPs for individual genes and corresponding 20× confocal images of HCR expression patterns of dorsal view, 16ss zebrafish embryos, showing overlap in expression and individual channel insets of sox10 in cyan and the following genes of interest in magenta: (D–E″) fli1 (n = 11), (F–G″) tfap2a (n = 8), (H–I″) ets1 (n = 8), (J–K″) sox9a (n = 6), (L–M″) foxc1b (n = 3), (N–O″) cxcr4b (n = 8), (P–Q″) prdm1a (n = 6), and (R–S″) mafba (n = 15). The white arrows indicate expression in preotic and/or postotic CdNC streams, and the white dotted circles outline the otic vesicle. Acronyms: NC, neural crest; r4, rhombomere 4; r6, rhombomere 6; Ot, otic vesicle. Position: A, anterior; P, posterior; D, dorsal; V, ventral; L, left; R, right; hb, hindbrain. (Scale bar, 50 μm.)
|
