
Fig. Ext Data 5
- ID
- ZDB-FIG-250421-19
- Publication
- Daetwyler et al., 2025 - Imaging of cellular dynamics from a whole organism to subcellular scale with self-driving, multiscale microscopy
- Other Figures
- All Figure Page
- Back to All Figure Page
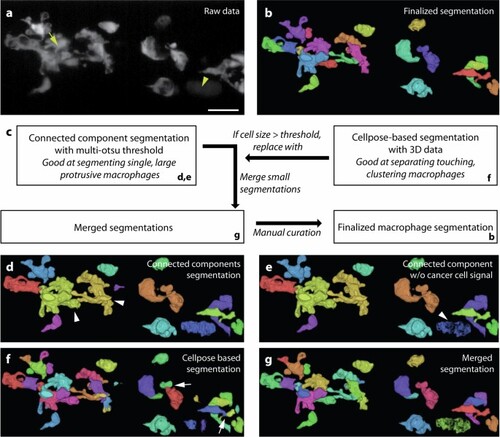
a Maximum intensity projection of a 3D volume in the caudal hematopoietic tissue visualizing zebrafish macrophages, labeled with Tg(mpeg1:EGFP)62, after xenografting human U-2 OS cells into the zebrafish larvae. As the cancer cells (yellow arrowhead) were labeled with a psmOrange fluorophore, there was bleed-through into the macrophage channel (GFP). Moreover, macrophages tended to cluster around cancer cells and at locations where cancer cells resided before they were phagocytosed by macrophages (yellow arrow). b 3D rendering with Fiji’s 3D viewer to display the final segmentation by the proposed workflow. c Schematic of the segmentation workflow. d We initially segmented the data with multi-Otsu thresholding and connected component labeling. This segmented individual macrophages well, for example in the control experiment (without xenografts) or at the beginning of the xenograft experiment. However, it could not separate touching macrophages (white arrowheads). e To clean up the segmentation, we first removed the cancer cell signal (white arrowhead) from the segmentation. f To separate clustering macrophages, we constructed 3D consensus segmentation from Cellpose-2D46 segmentations computed in orthogonal x–y, x–z, y–z views of the original raw data. While this segmentation separated clustering macrophages, it was observed to split individual macrophages into smaller fragments (white arrows) when the macrophages show extensive cytoplasmic extensions of several tens to hundreds of microns. g We merged the connected component segmentation and the Cellpose-based segmentation by replacing connected volumes that exceeded a defined threshold with the Cellpose-based segmentation. Moreover, we merged connected volumes that were below a certain threshold with neighboring volumes. Subsequent manual curation further cleaned up the segmentation of macrophages to obtain the finalized segmentation b. Scale bar lengths are as follows: a 30 μm. |