
Fig. 1
- ID
- ZDB-FIG-250421-12
- Publication
- Daetwyler et al., 2025 - Imaging of cellular dynamics from a whole organism to subcellular scale with self-driving, multiscale microscopy
- Other Figures
- All Figure Page
- Back to All Figure Page
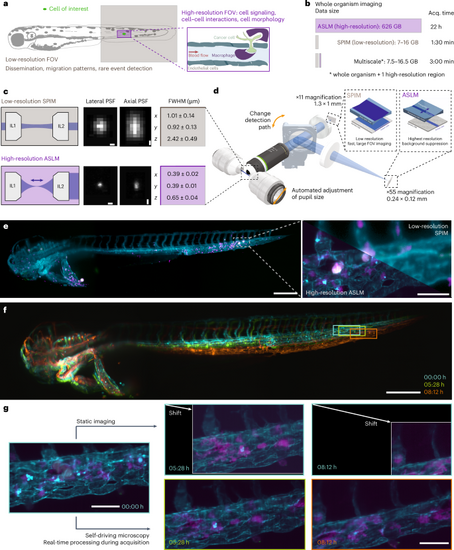
a, Schematic of the field of views of low- (brown) and high-resolution (violet) light-sheet microscopy modalities to image biological processes across scales. b, Calculations of the duration and resulting data sizes for imaging a 2.5-day-old zebrafish larva in one fluorescent channel with high-resolution imaging using axially swept light-sheet microscopy (ASLM), low-resolution imaging and a multiscale imaging approach that captures the whole organism and one selected region of interest with high-resolution. c, Schematic top-view light-sheet profiles of dual-sided multidirectional selective plane illumination microscopy (SPIM) (top, brown) for low-resolution imaging and single-sided ASLM for high-resolution imaging (bottom, violet), with the dark blue arrow indicating the scan direction of the thin ASLM light-sheet (left). Representative images of 0.2-μm fluorescent nanospheres for both modalities (middle). PSF values measured with MetroloJ (n = 20 for each modality) (right). d, Simplified rendering of the multiscale microscope. The low- and high-resolution modalities share the same illumination and detection objectives. In the detection path, a motorized flip mirror selects either the low-resolution or the high-resolution detection path. e, Representative images from the multiscale microscope displaying a 2.5-day-old zebrafish larva (cyan, vascular marker Tg(kdrl:Hsa.HRAS-mCherry); magenta, macrophage marker Tg(mpeg1:EGFP)) xenografted with U-2 OS osteosarcoma cells (white). Low-resolution image of the whole zebrafish larva (left). Zoom in to boxed image to compare the high-resolution image acquired with ASLM (bottom left) to the mSPIM image (top right) (right). f, Representative low-resolution stills from a time-lapse imaging experiment of zebrafish larva expressing the vascular marker Tg(kdrl:Hsa.HRAS-mCherry) are overlaid onto each other, with the color indicating imaging time (starting at 3 days after fertilization). This highlights sample movement and growth over the observation window and the shift of a region of interest over time (boxed region). g, High-resolution imaging with a static, pre-defined imaging volume within the microscope coordinate system (top) and self-driving microscopy (bottom). Same color scheme as in e. Scale bars, 0.5 μm (c); 250 μm (left), 60 μm (right) (e); 250 μm (f); 50 μm (g). FOV, field of view. |