
Fig. 3
- ID
- ZDB-FIG-250421-14
- Publication
- Daetwyler et al., 2025 - Imaging of cellular dynamics from a whole organism to subcellular scale with self-driving, multiscale microscopy
- Other Figures
- All Figure Page
- Back to All Figure Page
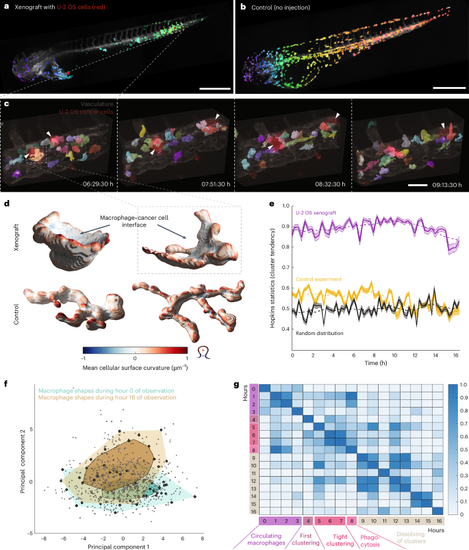
a, Low-resolution, 3D rendering of a zebrafish xenograft with U-2 OS osteosarcoma cancer cells (red), segmented macrophages (color scale, violet to green from head to tail) and a vasculature label, Tg(kdrl:Hsa.HRAS-mCherry) (gray). Boxed region indicates the location of high-resolution region in c. b, Low-resolution, 3D rendering of a zebrafish larva without xenograft (control) with segmented macrophages (color scale, violet to red from head to tail) and a vasculature label, Tg(kdrl:Hsa.HRAS-mCherry) (gray). c, 3D rendering of high-resolution stills with segmented macrophages (in color), U-2 OS cancer cells (red, white arrowhead) and vasculature (gray). Boxed region indicates individual macrophage highlighted in d. d, 3D renderings of individual macrophages from the high-resolution data of xenograft experiment (top) and control (bottom). Color indicates mean cellular curvature. e, Hopkins statistics (10% sampling, dimensionality d = 3) to analyze macrophage cluster tendency inside a zebrafish. A higher number indicates a higher cluster tendency with U-2 OS xenograft data in violet, control data (no xenograft) data in yellow, and a simulation of a randomized, uniform distribution in black. Data are displayed as mean ± 95% CI (n = 350 iterations for Hopkins statistic calculation). The dashed line indicates the moving average of ten time points. f, Global morphological feature analysis of macrophage shapes (gray points, n = 825 cells) from the high-resolution data of the U-2 OS cancer cell xenograft experiment over time, displayed in a PCA plot. Bagplots of all macrophage shapes in the first hour (hour 0; turquoise) and hour 16 (brown) of observation are overlaid. The bagplot consists of the Tukey median (cross), an inner polygon (darker color) that contains the 50% observations with largest Tukey depth and the outer polygon (lighter color) with all data excluding outliers. g, Change of macrophage shapes over time; all macrophage shapes within an hour of observation were compared to macrophage shapes at different hours by applying a permutation test (one-sided, no adjustment for multiple comparison, n = 3,000 iterations) using the Tukey median as a metric. The resulting P values were plotted as a heat map. Scale bars, 500 μm (a and b) and 50 μm (c). |