
Fig. Ext Data 2
- ID
- ZDB-FIG-250421-16
- Publication
- Daetwyler et al., 2025 - Imaging of cellular dynamics from a whole organism to subcellular scale with self-driving, multiscale microscopy
- Other Figures
- All Figure Page
- Back to All Figure Page
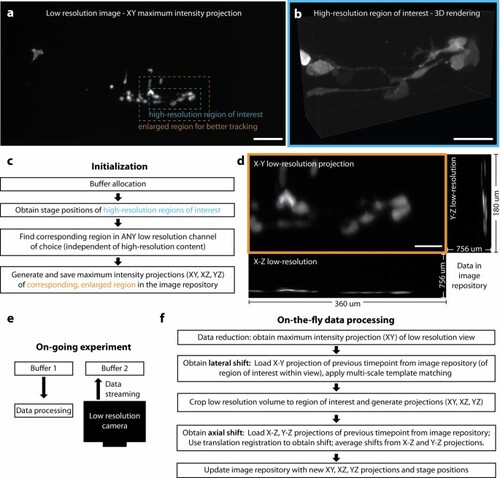
a Low-resolution maximum intensity projection of MDA-MB-231 breast cancer cells, labeled with F-tractin-GFP, in the zebrafish tail. Insets depict a high-resolution region of interest (blue, panel b) with its corresponding, enlarged (1.5x in both lateral dimensions) region used for better tracking. b 3D rendering of the high-resolution region of interest. c Schematic of the steps required for initialization of the region tracking algorithm. d X–Y, Y–Z, X–Z low-resolution maximum intensity projections saved in the image library at initialization, and each subsequent time point / update step. e Schematic of simultaneous data processing and acquisition (data streaming), enabled by a custom buffer architecture using shared memory arrays and tools from the concurrency tool library by Thayer, York et al. f Schematic of the pipeline for the update step to calculate on-the-fly the lateral and axial shifts for region tracking. Scale bar lengths are as follows: a 150 μm, b,d 50 μm. |