
Fig. 6
- ID
- ZDB-FIG-250416-49
- Publication
- Childers et al., 2025 - Protein absorption in the zebrafish gut is regulated by interactions between lysosome rich enterocytes and the microbiome
- Other Figures
- All Figure Page
- Back to All Figure Page
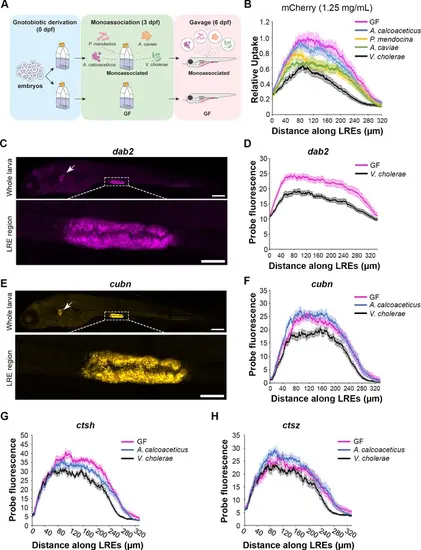
Lysosome-rich enterocyte (LRE) activity and expression of endocytic machinery are differentially affected by individual microbial strains. (A) Cartoon of monoassociation experimental design. Following gnotobiotic derivation, monoassociated larvae are colonized with a single strain of bacteria at 3 dpf and gavaged with mCherry to measure protein uptake at 6 dpf. (B) Plot shows relative uptake of mCherry in larvae that were germ-free (GF) or monoassociated with a single bacterial strain. mCherry uptake was reduced by A. calcoaceticus (two-way ANOVA, p=0.0268, n=19–20), P. mendocina (two-way ANOVA, p=0.0033, n=20–21), A. caviae (two-way ANOVA,p<0.0001, n=19–20) and V. cholerae (two-way ANOVA, p<0.0001, n=18–20). (C) Confocal images show dab2 hybridization chain reaction (HCR) probe localization in whole zebrafish larva (top) and LRE region (bottom). Arrow points to pronephros. Whole larva scale = 200 μm. LRE region scale = 50 μm. (D) Plot shows dab2 HCR probe fluorescence in the LRE region at 6 dpf. dab2 expression was significantly greater in GF than V. cholerae-colonized larvae (two-way ANOVA, p<0.0001, n=23). (E) Confocal images show cubn HCR probe localization in whole zebrafish larva (top) and LRE region (bottom). Arrow points to pronephros. Whole larva scale = 200 μm. LRE region scale = 50 μm. (F) Plot shows cubn HCR probe fluorescence in the LRE region at 6 dpf. There was greater cubn expression in A. calcoaceticus-colonized than GF larvae (two-way ANOVA, p=0.049, n=21–23), but V. cholerae significantly reduced cubn expression (two-way ANOVA, p<0.0001, n=16–23). (G) Plot of ctsh expression in GF and monoassociated larvae. GF larvae showed greater ctsh expression than A. calcoaceticus (two-way ANOVA, p=0.0183, n=10–12) or V. cholerae-colonized larvae (two-way ANOVA, p<0.0001, n=8–12). (H) Plot of ctsz expression in GF and monoassociated larvae. A. calcoaceticus and GF larvae showed similar levels of ctsz expression in LREs (two-way ANOVA, p=0.09, n=10–12). V. cholerae colonization reduced ctsz expression compared to GF larvae (two-way ANOVA, p=0.0014, n=8–12). |