
Fig. 3 - Supplemental 1
- ID
- ZDB-FIG-250416-44
- Publication
- Childers et al., 2025 - Protein absorption in the zebrafish gut is regulated by interactions between lysosome rich enterocytes and the microbiome
- Other Figures
- All Figure Page
- Back to All Figure Page
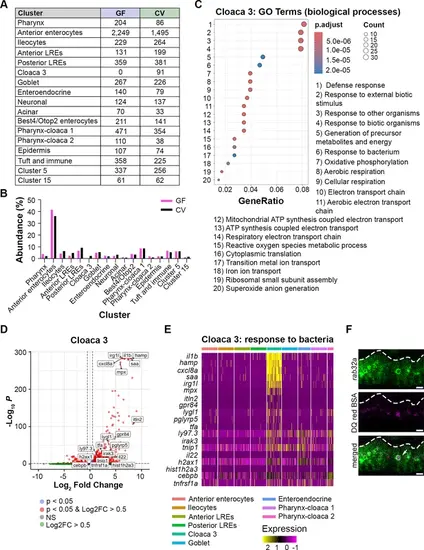
Cell counts and features of conventional (CV)-specific Cloaca 3 cells. (A) Table showing the number of germ-free (GF) and CV cells per cluster in the single-cell RNA sequencing (scRNA-seq) dataset. (B) Bar plot showing the % abundance of cells that fell within each cluster in the GF and CV datasets. Both conditions showed comparable proportions of cells per cluster except for Cloaca 3, which only appeared in the CV dataset. (C) Dot plot displays the GO terms that were upregulated in Cloaca 3 cells. The dot color indicates the adjusted p-value for each GO term, while the dot size signifies the number of genes expressed in Cloaca 3 cells that fall into each GO term category. GeneRatio describes the proportion of genes associated with each GO term. (D) Volcano plot illustrates markers upregulated in the Cloaca 3 cluster. Red points with log2FC >0.5 are genes significantly upregulated in Cloaca 3 cells compared to other intestinal epithelial cells (IECs). Labeled genes were categorized in the GO term ‘response to bacterium.’ (E) Heatmap displays genes that were included in the ‘response to bacterium’ GO term, which was upregulated in Cloaca 3. Cluster identity is indicated by the colored bars at the top of the heatmap. Expression level is shown by a color gradient, with yellow indicating the highest expression level. (F) Live confocal microscopy images of lysosome-rich enterocytes (LREs) in 6 dpf larva expressing GFP-rab32a following gavage with DQ red BSA. DQ red BSA fluorescence was localized to the lysosome (arrow). Scale bars = 5 μm. |