
Fig. 4 - Supplemental 1
- ID
- ZDB-FIG-250416-46
- Publication
- Childers et al., 2025 - Protein absorption in the zebrafish gut is regulated by interactions between lysosome rich enterocytes and the microbiome
- Other Figures
- All Figure Page
- Back to All Figure Page
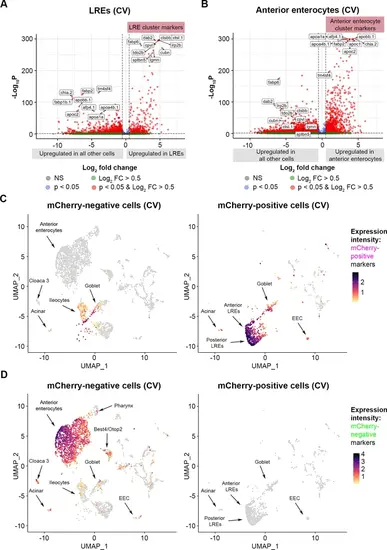
Lysosome-rich enterocyte (LRE) and anterior enterocyte marker expression delineates mCherry-positive and mCherry-negative cells. (A) Volcano plot displays LRE marker genes in all cells within the conventional (CV) dataset. The top differentially expressed genes (DEGs) between LREs and other cells are tagged. Genes with a red dot and log2FC >0.5 are significant LRE cluster markers. (B) Volcano plot displays anterior enterocyte marker genes in all cells within the CV dataset. The top DEGs between anterior enterocytes and other cells are tagged. Genes with a red dot and log2FC >0.5 are anterior enterocyte cluster markers. (C) UMAP projections show expression of the top DEGs in mCherry-positive cells compared to mCherry-negative cells (ctsbb, lrp2b, ctsl.1, dab2, cpvl, cubn, tdo2b, lgmn, fabp6, sptbn5) in the CV dataset. The cell color gradient intensity indicates the cumulative expression level of these genes. Left: UMAP projection displays all sorted mCherry-negative cells in the CV dataset. Right: UMAP projection displays sorted mCherry-positive cells in the CV dataset. (D) UMAP projections show expression of the top DEGs in mCherry-negative cells compared to mCherry-positive cells (fabp2, chia.2, fabp1b.1, apobb.1, apoa4b.1, apoa1a, tm4sf4, afp4.1, apoc2, apoc1) within the CV dataset. The cell color gradient intensity indicates the cumulative expression level of these genes. Left: UMAP projection displays all sorted mCherry-negative cells in the CV dataset. Right: UMAP projection displays all sorted mCherry-positive cells in the CV dataset. |