
Fig. 3
- ID
- ZDB-FIG-250416-43
- Publication
- Childers et al., 2025 - Protein absorption in the zebrafish gut is regulated by interactions between lysosome rich enterocytes and the microbiome
- Other Figures
- All Figure Page
- Back to All Figure Page
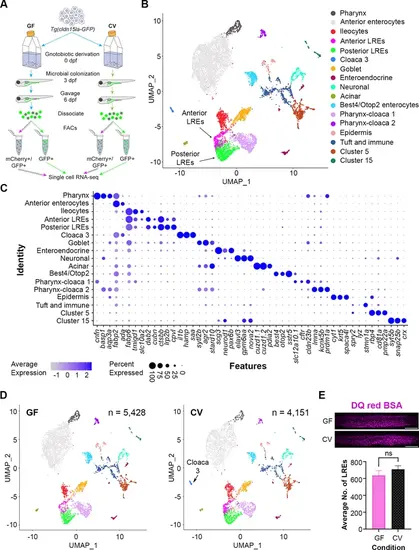
Single-cell clustering reveals anterior and posterior lysosome-rich enterocytes (LREs), microbially-responsive cloaca cells. (A) Cartoon depicting experimental design for transcriptomic profiling of intestinal cells in germ-free (GF) and conventional (CV) larvae. GF and CV larvae expressing Tg(cldn15la-GFP) to label all intestinal epithelial cells (IECs) were raised to 6 dpf in gnotobiotic conditions and then gavaged with mCherry (1.25 mg/mL). Cells from dissociated larvae were fluorescent-activated cell sorting (FACs) sorted to isolate GFP-positive/mCherry-positive from GFP-positive/mCherry-negative populations prior to single cell sequencing. (B) UMAP projection of cells color-coded by cluster identity. (C) Dot plot of top cluster markers in each cluster. Average expression of the marker gene in each cell cluster is signified by the color gradient. Dot size indicates the percentage of cells in each cluster expressing the marker. (D) UMAP projection of cells color-coded by cluster identity in the GF (left) and CV (right) datasets. The Cloaca 3 cluster only appeared in the CV dataset. (E) Bar plot showing that the average number of LREs in the GF and CV larvae was not significantly different (two-tailed t-test, p=0.33, n=10). LREs were labeled by gavaging with DQ red BSA (50 µg/mL) in a separate experiment, then quantified. Images show DQ red BSA marking LRE lysosomal vacuoles (scale bar = 50 µm). |