
Figure 7
- ID
- ZDB-FIG-250325-42
- Publication
- Ravel et al., 2025 - Modeling zebrafish escape swim reveals maximum neuromuscular power output and efficient body movement adaptation to increased water viscosity
- Other Figures
- All Figure Page
- Back to All Figure Page
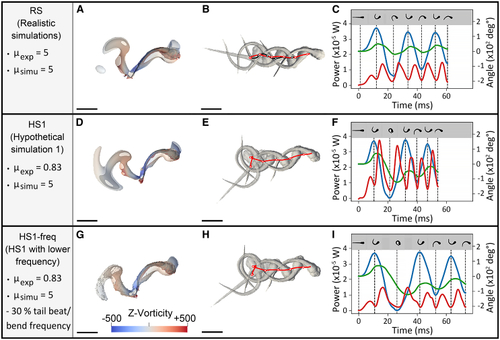
EFP-induced escape response swimming performances of isolated body movements recorded in media of 5 mPa⋅s as opposed to recordings in water, the viscosity of which was virtually increased to 5 mPa⋅s (A–I) Realistic numerical simulations (RS) of body movements were recorded in media of 5 mPa⋅s (A–C). Hypothetical simulations were obtained using movements recorded in water (0.83 mPa⋅s) followed by a virtual enhancement of viscosity to 5 mPa⋅s, before (hypothetical simulations 1 (HS1), D–F) or after (hypothetical simulations with lower frequency (HS1-freq), G–I) applying a 30% decrease in tail bend/beat frequency, which resulted in CoT, energy expenditure and distance traveled values that matched those of RS. (A, D, G) Fluid vorticity in rotations per second (sˆ-1) along the z axis after 1.5 swimming tail bends in realistic simulations (A) and in hypothetical simulations before (D) and after (G) slowing tail movement frequency. Fluid flow was visualized as the isocontours of the Q-criterion colored by fluid vorticity along the vertical axis (z axis). (B, E, H) Corresponding trajectories obtained during simulations (in red). Zebrafish shapes at each body curvature maximum are shown in gray. (C, F, I) Associated power output (red curves) (x10−5 W) over time displayed along the head-tail angle, i.e., body midline curvature (blue curves) and body rotation (green curves), expressed in both cases in angle values (x102 deg°). The local maxima of isolated body movements are indicated as vertical dashed lines and corresponding shapes are depicted above. Scale bar: 1 mm. Experimental and simulated viscosities, respectively μexp and μsimu, in which fish motions were recorded or virtually computed, are specified as mPa⋅s (left panel). See also |