
Figure 5
- ID
- ZDB-FIG-250325-40
- Publication
- Ravel et al., 2025 - Modeling zebrafish escape swim reveals maximum neuromuscular power output and efficient body movement adaptation to increased water viscosity
- Other Figures
- All Figure Page
- Back to All Figure Page
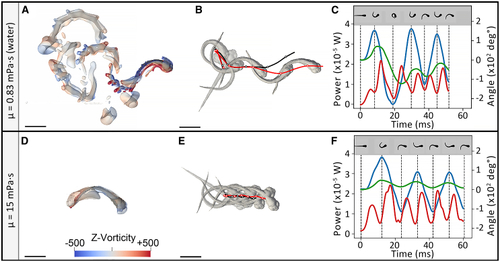
Swimming performance of zebrafish eleutheroembryo in water (μ = 0.83 mPa⋅s) (A–C) and in a high viscosity fluid (15 mPa⋅s) (D–F). (A and D) Fluid vorticity along the z axis after 1.5 swimming tail-beats (A) in water and (D) in a high viscosity fluid. Fluid flow was visualized as the isocontours of the Q-criterion colored by fluid vorticity in rotations per second (sˆ-1) along the vertical axis (z axis). (B and E) Corresponding trajectories obtained during simulation (in red) and kinematic analysis (in black). Zebrafish shapes at each body curvature maximum are shown in gray. (C and F) Associated power output (red curves) (x10−5 W) over time displayed along with body curvature, corresponding to the curvature of the midline (blue curves), and the body rotation (green curves), expressed in both cases as angle values (x102 deg°). The local maxima of the body movements are indicated as vertical dashed lines and corresponding shapes are depicted above. Scale bar: 1 mm. See also |