FIGURE

Figure 4

ID
ZDB-FIG-250325-39
Publication
Ravel et al., 2025 - Modeling zebrafish escape swim reveals maximum neuromuscular power output and efficient body movement adaptation to increased water viscosity
Other Figures
All Figure Page
Back to All Figure Page
Figure 4

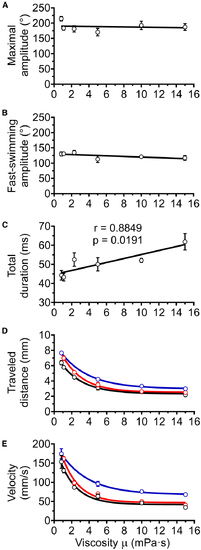
Kinematic analysis of zebrafish EFP-induced escape response across variations in experimental and in silico fluid viscosity

Parameters were measured by kinematic analysis recorded from original movies (back lines) or through numerical simulations. Numerical simulations were performed with isolated body movements recorded in media of 0.83–15 mPa⋅s (red lines) or with the movements recorded in water (0.83 mPa⋅s) followed by computational enhancements of viscosity up to 15 mPa⋅s (blue lines).

(A) Maximal head-tail angle, which measures the amplitude of the C-bend and counterbend, was not correlated with viscosity.

(B) Fast-swim beat amplitude, defined as average amplitude of peaks during fast swimming, was not correlated with viscosity.

(C) Total time for completion of the initial six tail bend/beats increased with viscosity. Total escape duration was significantly correlated with fluid viscosity as tested by Pearson’s test, and the linear regression slope was significantly different from zero (p < 0.001). Coefficient of determination R2 = 0.78 for the linear regression. For A, B, and C, the only line shown was extracted from kinematic analyses (black lines), because the midline bending values and the total duration required for six tail bends/beats were body movement descriptors that were used as input for the numerical simulations, and were therefore identical to them.

(D) Distance traveled over six tail bend/beats measured through kinematic analysis on original videos and during simulations. Coefficients of determination R2 > 0.95 for both nonlinear regressions.

(E) The average escape velocity, calculated over the duration of the six tail bends/beats, decreased exponentially with both experimental and in silico increases in viscosity. The coefficients of determination R2 > 0.90 for both nonlinear regressions. Data represented correspond to mean ± SEM of three escape responses per viscosity condition over six tail movements: C-bend, counterbend followed by four fast swimming tail-beats. The significance was tested using a two-way ANOVA and Sidak’s multiple comparisons post-hoc test. (D, E) The only significant differences between the measured parameters recorded from original movies (black lines) and movement simulations recorded in media of 0.83–15 mPa⋅s (red lines) occurred at the viscosities of 0.83 and 1 mPa⋅s (p < 0.01). In viscosities between 5 and 15 mPa⋅s, there were significant or close to significant differences (p < 0.039 to p < 0.057) in the value of these kinetic parameters between numerical simulations obtained from body movements recorded in media of different viscosities (red lines) and the simulations based upon movements recorded in water followed by virtual enhancement of viscosity up to 15 mPa⋅s (blue lines). See also Figure 3.

Expression Data

Expression Detail
Antibody Labeling
Phenotype Data

Phenotype Detail
Acknowledgments
This image is the copyrighted work of the attributed author or publisher, and ZFIN has permission only to display this image to its users. Additional permissions should be obtained from the applicable author or publisher of the image. Full text @ iScience