
Figure 3
- ID
- ZDB-FIG-250325-38
- Publication
- Ravel et al., 2025 - Modeling zebrafish escape swim reveals maximum neuromuscular power output and efficient body movement adaptation to increased water viscosity
- Other Figures
- All Figure Page
- Back to All Figure Page
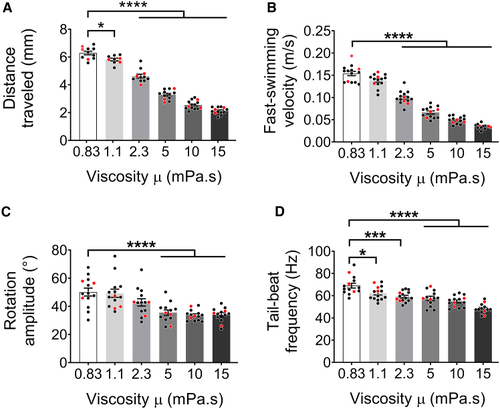
Swimming kinematics of zebrafish escape responses recorded in six viscosities between 0.83 (water) and 15 mPa⋅s (A) Distance traveled over six tail bend/beats. (B) Fast-swimming velocity during the fast-swimming stage, i.e., mean velocity during the two-fast-swimming cycles after the C-bend and counterbend stages. (C) Rotation amplitude, computed as the average of rotation maxima during the escape swim. (D) Tail-beat frequency during the fast-swimming stage. Data represented correspond to mean ± SEM of 10–15 escape responses per viscosity condition. For each viscosity experiment, the three red points represent the individuals selected for the subsequent numerical simulations. Significance of differences in measured parameters was assessed by ANOVA followed by post-hoc Dunnett test; ∗ |