
Fig. EV6
- ID
- ZDB-FIG-240802-52
- Publication
- Kumar et al., 2024 - Whole-body replacement of larval myofibers generates permanent adult myofibers in zebrafish
- Other Figures
- All Figure Page
- Back to All Figure Page
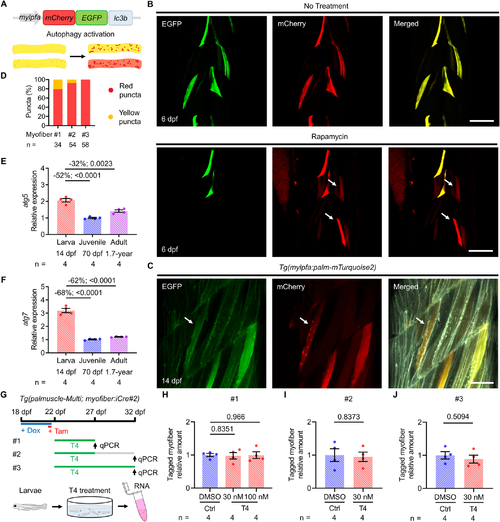
Live monitoring of autophagic activation in deformed myofibers. (A) The transgenic construct for live monitoring of autophagic activation in myofibers. (B) Treatment with rapamycin activates autophagic response in myofibers. White arrows point to activated, mCherry-positive myofibers. Of note, without the treatment of rapamycin, all 6 dpf myofibers were both EGFP- and mCherry-positive. (C) Deformed myofibers contain abundant red puncta. White arrow points to a deformed myofiber. (D) Percentages of red and yellow puncta in three individual deformed myofibers. (E, F) RT-qPCR was performed to analyze expression of the autophagic genes atg5 (E) and atg7 (F) in whole animals (14 dpf) or dissociated myofibers (70 dpf and 1.7 years of age). (G) Timeline and three different thyroxine hormone (T4) treatment schemes. (H–J) RT-qPCR analysis of the whole-animal myofiber loss for each of the schemes. Data from biological replicates are shown as mean ± standard error (E, F, H, I, J). Significance was examined by two-tailed Student’s t-test. Percent differences and P values are shown above the horizontal lines for intergroup comparisons. n = number of puncta (D) or biological replicates (E, F, H, I, J). Scale bars, 100 µm (B); 50 µm (C). dpf, days post-fertilization. |