
Fig. EV2
- ID
- ZDB-FIG-240802-44
- Publication
- Kumar et al., 2024 - Whole-body replacement of larval myofibers generates permanent adult myofibers in zebrafish
- Other Figures
- All Figure Page
- Back to All Figure Page
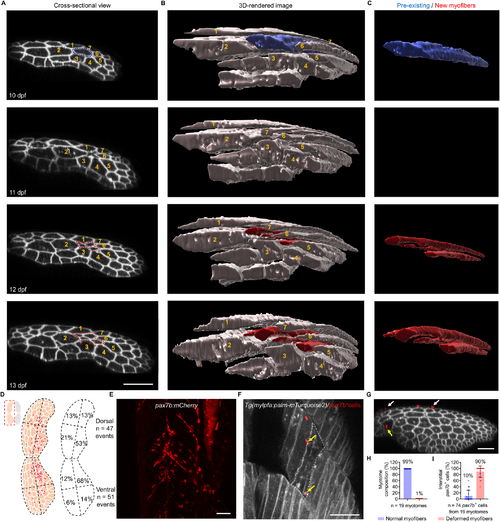
Individual deformed myofibers are fully eliminated and replaced. (A–C) Time-lapse images of the same myotome over a 3-day period, showing the myofiber elimination and the replacement processes in a cross-sectional view (A) or as a 3D rendering (B, C). Blue dashed lines outline a deformed myofiber. Red dashed lines outline newborn myofibers. Neighboring myofibers are labeled with respective numbers. (D) Spatial distribution of deformed myofibers in the dorsal and ventral myotomes. A total of 98 dissolution events were captured and mapped. (E) Representative image of pax7b-positive muscle stem cells expressing mCherry. (F) Representative image showing pax7b-positive cells (yellow arrows) in close proximity to a deformed myofiber. (G) Cross-sectional view of a myotome showing pax7b-positive cells located either at the myotome’s periphery (white arrows) or within the interstitial space (yellow arrows). (H, I) Quantification of myofiber composition within a myotome (H) and the interstitial pax7b-positive cells closely associated with either normal or deformed myofibers (I). Data from biological replicates are shown as mean ± standard deviation (H, I). n = number of myotome (H) or cells (I). Scale bar, 50 µm (A, E–G). |