
Fig. 7
- ID
- ZDB-FIG-240802-51
- Publication
- Kumar et al., 2024 - Whole-body replacement of larval myofibers generates permanent adult myofibers in zebrafish
- Other Figures
- All Figure Page
- Back to All Figure Page
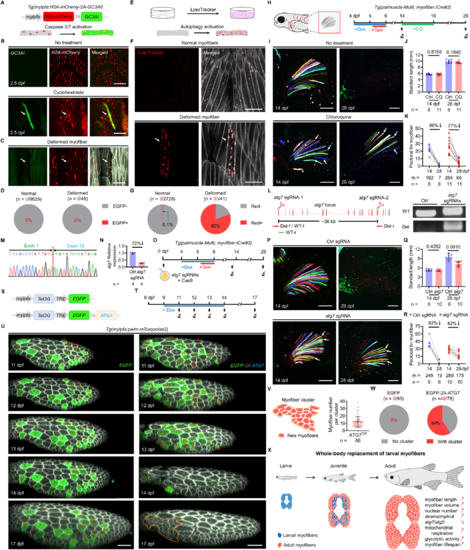
Autophagic cell death eliminates larval myofibers to promote local myofiber birth. (A) The transgenic construct for live monitoring of apoptotic responses in the myofibers. (B) Treatment with cycloheximide activates apoptosis in the myofibers. White arrow points to an EGFP-positive myofiber. (C) Deformed myofibers show no EGFP signals. White arrow points to a deformed myofiber. (D) Quantification of the EGFP-positive myofibers either in the normal or the deformed populations. (E) The application of LysoTracker red for detecting autophagic activation in the myofibers. (F) Deformed myofibers contain the LysoTracker red signals. White arrow points to a deformed myofiber. (G) Quantification of the LysoTracker red-positive myofibers either in the normal or the deformed populations. (H) Timeline of the treatment and tracking schemes. (I) Treatment of chloroquine (CQ) attenuates myofiber elimination. White arrows point to persisting myofibers. (J, K) Standard length of the animals (J) and quantitative evaluation of tagged myofiber number (K). Since animal growth rates can affect the myofiber elimination, the analyses only include larvae with standard length more than 9 mm at 28 dpf. (L, M) CRISPR-Cas9-mediated deletion of the atg7 locus and evaluation of the deletion alleles by PCR amplification of genomic DNA (L) and Sanger sequencing (M). The sgRNA pair removes the ~36 kb genomic region between Exon 1 and Exon 19. (N) RT-qPCR analysis of CRISPR-Cas9-mediated knockdown of the atg7 expression. (O) Timeline of the treatment and tracking schemes. (P) Pectoral fin myofibers images from 14 dpf larvae injected with either control sgRNAs or atg7-targeting sgRNAs. White arrows point to persisting myofibers. (Q, R) Standard lengths of the animals (Q). Quantitative evaluation of tagged myofiber number (R). Of note, animals injected with sgRNAs targeting atg7 exhibited reduced growth by 28 dpf. (S) The transgenic constructs for inducible overexpression of ATG7. (T) Timeline of the Dox treatment and tracking schemes. (U) Time-lapse images of the same myotome over a 6-day period with overexpression of either EGFP (left) or EGFP/ATG7 (right). The EGFP and EGFP/ATG7-positive myofibers are marked with respective numbers. Orange dashed line highlights a myofiber cluster. (V) Quantification of the myofiber number within each cluster. Of note, concurrent births of five or more than five adjacent myofibers were defined as a myofiber cluster. OX, overexpression. (W) Quantitative myofiber cluster appearance in the EGFP- and EGFP/ATG7-overexpression groups. (X) Schematic drawing depicts the process of whole-body replacement of larval myofibers. Data from biological replicates are shown as mean ± standard deviation (J, Q, V) or mean ± standard error (N). Significance was examined by two-tailed Mann–Whitney test (J, Q) or two-tailed Student’s t-test (N). Percent differences and P values are shown above the horizontal lines for intergroup comparisons. m = number of myofibers (K, R). n = number of animals (J, K, Q, R), myofibers (D, G), clusters (V), or myotomes (W). Scale bar, 50 µm (B, C, F, U); 100 µm (I, P). dpf, days post-fertilization. Source data are available online for this figure. |