
Fig. 5
- ID
- ZDB-FIG-240802-46
- Publication
- Kumar et al., 2024 - Whole-body replacement of larval myofibers generates permanent adult myofibers in zebrafish
- Other Figures
- All Figure Page
- Back to All Figure Page
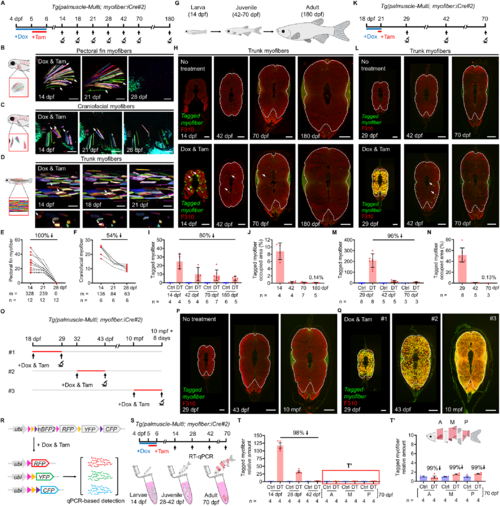
Most larval myofibers are eliminated by adult stages. (A) Timeline of the tracking scheme. (B–D) Long-term time-lapse imaging of the same myofibers in different anatomical regions, including pectoral fin myofibers (B), craniofacial myofibers (C), and trunk myofibers (D). White arrows highlight myofibers that “disappear” from later time points. (E, F) Quantitative changes in the tagged myofiber number. Of note, the analyses include only larvae with standard length more than 9 mm at 28 dpf. (G) Schematic drawing of zebrafish at larval, juvenile and adult stages, reflecting their relative size difference. (H) Histological examinations of the tagged myofibers in the middle-trunk region of the animals at 14, 42, 70, and 180 dpf. White arrows point to remaining myofibers. White dashed line encircles the area containing fast muscle fibers (42, 70, and 180 dpf). F310 Ab stains fast myofibers. (I, J) Quantitative analysis of tagged myofiber number (I), and percent area occupied by the tagged myofibers (J). The tagged myofiber numbers from two to three consecutive cross-sections were counted and averaged for each individual. (K) Timeline of the tracking scheme. (L) Histological examinations of the tagged myofibers in the middle-trunk region of the animals at 29, 42, and 70 dpf. White arrows point to remaining myofibers at 42 dpf. White dashed line encircles the area containing fast muscle fibers. F310 Ab stains fast myofibers. (M, N) Quantitative analysis of tagged myofiber number (M), and percent area occupied by the tagged myofibers (N). The tagged myofiber numbers from two to four consecutive cross-sections were counted and averaged for each individual. (O) Timeline of the treatment and tracking scheme. (P, Q) Histological examinations of the tagged myofibers in the middle-trunk region of the animals at 29, 43 dpf, and 10 mpf showed no leaky Cre activity (P). A short pulse of Dox and Tam labeled most of the trunk fast myofibers (Q). White dashed line encircles the area containing fast muscle fibers. Number of animals examined—8, 6, 4 (29 dpf, 43 dpf, 10 mpf, P); 8, 5, 3 (29 dpf, 43 dpf, 10 mpf, Q). F310 Ab stains fast myofibers. (R) Schematic drawing of the palmuscle-Multi cassettes before and after Cre activation. qPCR primers were designed to detect transcripts from the recombined Brainbow cassettes, targeting the common sequences of mCherry, mYFP, and mCerulean. (S) Timeline of the sampling scheme. (T, T’) RT-qPCR analysis of the whole-animal myofiber loss at 14, 28, 42 and 70 dpf (T), and an enlarged view of the 70 dpf data (T’). Of note, three separate body compartments—Anterior (A), Middle (M), and Posterior (P)—were collected at 70 dpf, owing to the substantial size of the fish at this stage. Data from biological replicates are shown as mean ± standard deviation (I, J, M, N) or mean ± standard error (T, T’). m = myofibers (E, F). n = number of animals (E, F, I, J, M, N) or biological repeats (T, T’). Stitched image (H, L, P, Q). Scale bar, 100 µm (B–D); 100 µm (H, 14 dpf) and (L, P, Q, 29 dpf); 300 µm (H, L, 42 dpf; P, Q, 43 dpf); 500 µm (H, L, 70 and 180 dpf; P, Q, 10 mpf). dpf, days post-fertilization. mpf, months post-fertilization. Source data are available online for this figure. |