
Fig. 1
- ID
- ZDB-FIG-240802-40
- Publication
- Kumar et al., 2024 - Whole-body replacement of larval myofibers generates permanent adult myofibers in zebrafish
- Other Figures
- All Figure Page
- Back to All Figure Page
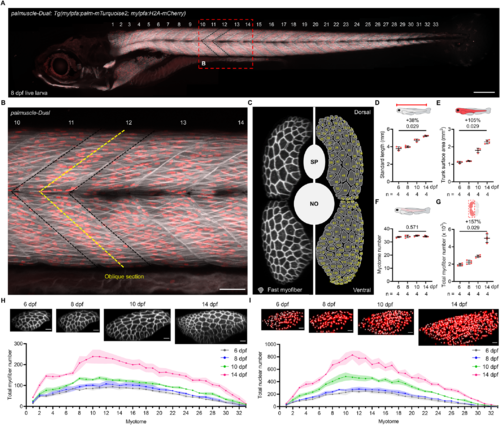
In toto monitoring of muscle growth in developing zebrafish. (A) Whole-animal view of a live palmuscle-Dual zebrafish larva at 8 dpf (days post-fertilization). Every myotome is marked by a number. Black dashed lines highlight Myotome #12. (B) Magnified view of the body region indicated in (A) by a red dashed box. Yellow dashed lines mark the planes of optical sectioning used to create the displayed cross-sectional view. (C) Representative cross-sectional view of Myotome #12 (left). The schematic drawing on the right mirrors and marks every myofiber within the myotome. SP, spinal cord. NO, notochord. (D–G) Larval growth as determined by standard length (D), trunk surface area (E), myotome number (F), and total myofiber number (G). (H, I) Total myofiber number and the total nuclear number in each myotome from live palmuscle-Dual at 6, 8, 10, and 14 dpf. Solid lines indicate mean and colored shadows highlight standard deviation. Representative ventral myotome images from each time point are shown above the graphs. Data from biological replicates are shown as mean ± standard deviation (D–G). Significance was examined by two-tailed Mann–Whitney test. Percent differences and P values are shown above the horizontal lines for intergroup comparisons. n = number of animals (D–G). Stitched image (A). Scale bars, 200 µm (A); 50 µm (B); 25 µm (H, I). dpf, days post-fertilization. Source data are available online for this figure. |