
Fig. 3
- ID
- ZDB-FIG-240802-43
- Publication
- Kumar et al., 2024 - Whole-body replacement of larval myofibers generates permanent adult myofibers in zebrafish
- Other Figures
- All Figure Page
- Back to All Figure Page
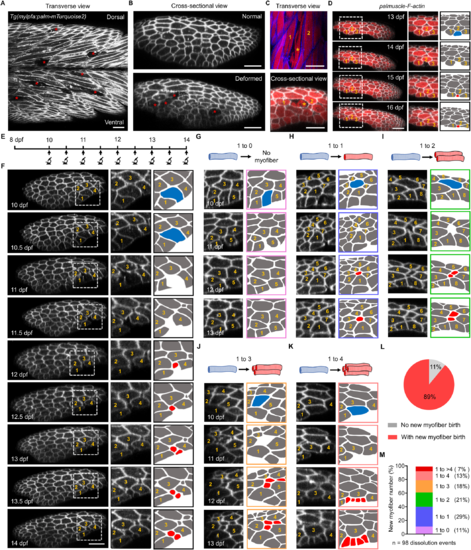
Same myofiber tracking in vivo identifies quid pro quo myofiber birth. (A) Transverse view of the trunk region in the Tg(mylpfa:palm-mTurquoise2) line. Red asterisks mark deformed myofibers. (B) Cross-sectional view of a myotome with either ordinary myofibers (top) or deformed myofibers (bottom). Red asterisks mark deformed myofibers. (C) Transverse (top) and cross-sectional (bottom) views of normal and deformed myofibers in palmuscle-F-actin: Tg(mylpfa:palm-mTurquoise2; mylpfa:LifeAct-mScarlet), showing disorganized actin cytoskeleton in a deformed myofiber (yellow asterisk). Neighboring myofibers are labeled with respective numbers. (D) Time-lapse images of the same myotome over a 3-day period, showing a myofiber dissolution event. Magnified view of the region indicated on the left by a white dashed box (middle). Schematic drawing of the magnified region (right) highlights the deformed myofibers (blue) and the newborn myofibers (red). Neighboring myofibers are labeled with respective numbers. (E) Timeline of the tracking scheme. (F) Time-lapse images of the same myotome over a 4-day period at a 12-h interval (left). Magnified view of the region indicated on the left by a white dashed box (middle). Schematic drawing of the magnified region (right) highlights both the deformed myofibers (blue) and the newborn myofibers (red). Neighboring myofibers are labeled with respective numbers. (G–K) Representative time-lapse images of the different dissolution-replacement events. The removal of a single deformed myofiber is spatiotemporally coupled with either no myofiber birth (G), or the birth of either one (H), two (I), three (J), or four myofibers (K). (L, M) All 98 captured dissolution events were categorized as being coupled with no or new myofiber birth (L), and by the number of new myofibers (M). Scale bar, 50 µm (A–D, F). dpf, days post-fertilization. Source data are available online for this figure. |