|
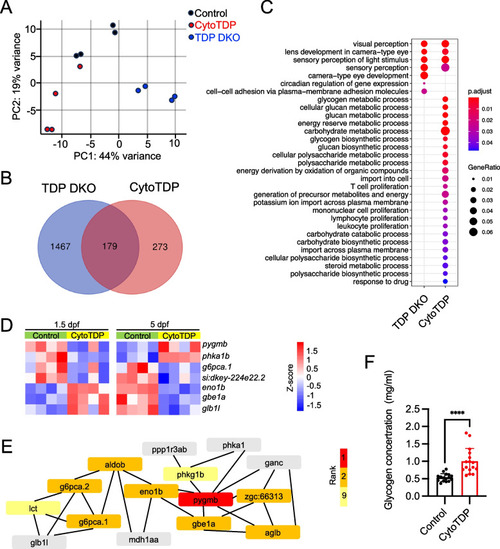
CytoTDP affects key metabolic processes. A Principal component analysis (PCA) of RNA sequencing results showed a strong separation of genotypes among the three groups of zebrafish (TDP DKO, CytoTDP and Control). B Venn diagram representation of the number of differentially expressed genes in TDP DKO (blue) and CytoTDP (red) compared to Control. C Gene ontology analysis of the biological process of genes differentially expressed of TDP DKO and CytoTDP compared to Control, respectively. D Heatmap of significantly mis-regulated genes in carbohydrate metabolic pathways in 1.5 dpf and 5 dpf CytoTDP fish. E Hub genes were identified through Cytoscape, with the color intensity representing the gene's ranking. F Quantification of glycogen concentrations revealed that the glycogen concentrations in 5 dpf CytoTDP embryos (n = 16) were 1.87 fold higher than in Control (n = 16) (****p < 0.0001, Unpaired T test)
|