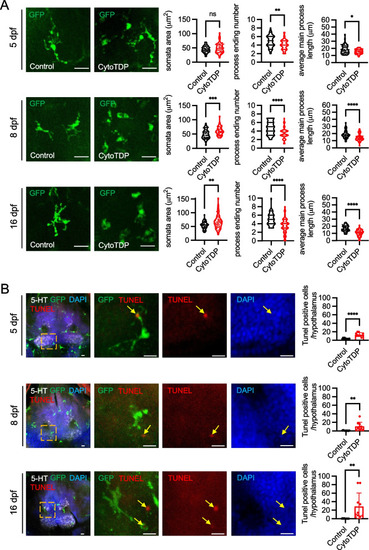
Microglia activation in the hypothalamus of CytoTDP. A Representative images of mpeg1.1-eGFP positive microglia in hypothalamus from Control and CytoTDP at 5 dpf, 8 dpf and 16 dpf. Scale bars = 20 μm. Violin plots show the area of somata, number of main processes, and average main process length of mpeg1.1-eGFP positive microglia in CytoTDP and Control at 5 dpf, 8 dpf and 16 dpf. 5 dpf (somata area p = 0.2165, number of main processes ** p = 0.0068, average main process length * p = 0.0308), 8 dpf (somata area *** p = 0.0008, number of main processes **** p < 0.0001, average main process length **** p < 0.0001), 16 dpf (somata area ** p = 0.003, number of main processes **** p < 0.0001, average main process length **** p < 0.0001), n = 50 cells for each group, unpaired T test. Each point represents one cell. B Representative maximum intensity projections of confocal images of mpeg1.1-eGFP CytoTDP fish after whole-mount immunostaining with tissue clearing and quantifications of TUNEL positive cells in the hypothalamus of CytoTDP fish and Control fish at 5 dpf, 8 dpf and 16dpf. 5-HT, mpeg1.1-eGFP positive microglia, TUNEL and DAPI signals are in gray, green, red and blue, respectively. Colocalization of TUNEL apoptotic DNA fragments, DAPI stained nuclei and microglia processes (yellow arrows) are evident in CytoTDP zebrafish through all the checked time points. Scale bars = 10 μm. 5 dpf Control vs 5 dpf CytoTDP **** p < 0.0001, 8 dpf Control vs 8 dpf CytoTDP ** p = 0.0061, 16 dpf Control vs 16 dpf CytoTDP ** p = 0.0099, unpaired T test, n = 10 larvae for each group, Error bars indicates ± SD
|
