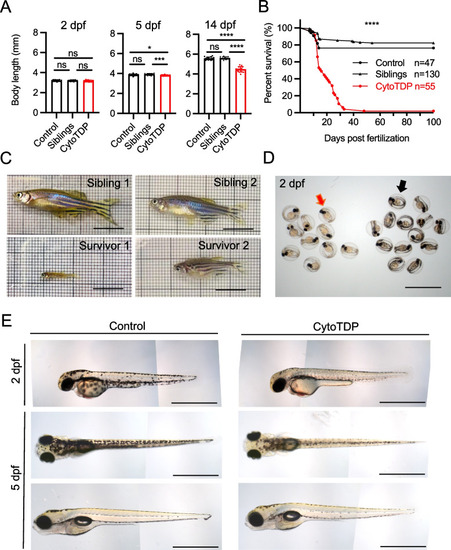
Morphological characterization of CytoTDP fish. A Quantification of body length of CytoTDP (red dots) and its siblings [Siblings (black arrow heads): tardbp ΔNLS/ + ; tardbpl -/-, Control (black dots): tardbp + / + ; tardbpl -/-] at 2 dpf, 5 dpf and 14 dpf. CytoTDP larvae have a similar body length at 2 dpf but are smaller at 5 dpf and even more severe at 14 dpf. 2 dpf ANOVA test [p = 0.4073, Unpaired T test: Control vs Siblings p > 0.9999, Control vs CytoTDP p = 0.2528, Siblings vs CytoTDP p = 0.2445]; 5 dpf ANOVA test [p = 0.0012, Unpaired T test: Control vs Siblings p = 0.0894, Control vs CytoTDP * p = 0.0414, Siblings vs CytoTDP *** p = 0.0002]; 14 dpf ANOVA test [p < 0.0001, Unpaired T test: Control vs Siblings p = 0.4227, Control vs CytoTDP **** p < 0.0001, Siblings vs CytoTDP **** p < 0.0001]; Control n = 16, Siblings n = 15, CytoTDP n = 16. Error bars indicates ± SD. B Kaplan Mayer blot of CytoTDP (n = 47) and its siblings [Control (tardbp + / + ; tardbpl-/-) (n = 55), Siblings (tardbp ΔNLS/ + ; tardbpl-/-) (n = 130)]. 94.55% of CytoTDP larvae die within one month, only 1.82% CytoTDP larvae survive longer than 3 months. Mantel-Cox test, p < 0.0001. C Pictures of 2 CytoTDP survivors, 5 months old (left panel) and 6 months old (right panel), respectively. Survivors are of smaller size compared to their siblings. Scale bar = 1 cm. D Petri dish with sorted 2 dpf CytoTDP larvae according to their pigmentation phenotype (red arrow) and their siblings (black arrow). Scale bar = 2 mm. E Hypopigmented CytoTDP embryos display strongly reduced pigmentation compared to their siblings at 2 dpf (lateral view, top panel). At 5 dpf the hypopigmentation pigmentation is still clearly visible from a dorsal view (middle panel) but is less pronounced from a lateral perspective (bottom panel). Scale bar = 1 mm
|
