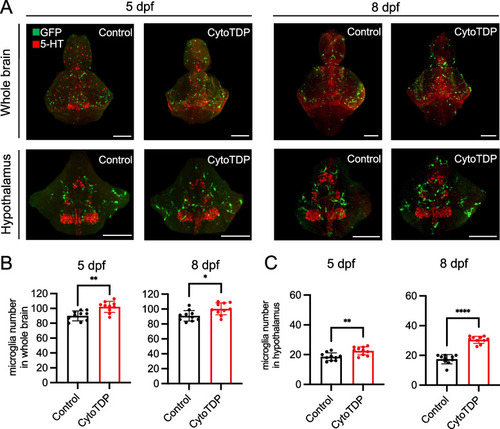
Microglia proliferation in the hypothalamus of CytoTDP. A Representative dorsal views of segmented whole-brain (top panel) and hypothalamus (lower panel) images using tissue clearing and whole-mount immunostaining of microglia at 5 dpf and 8 dpf. Co-staining against 5-hydroxytryptamine (5-HT) was used as a counterstain for the hypothalamus in zebrafish [38]. Confocal scans of mpeg1.1-eGFP positive microglia (green) and 5-HT (red) CytoTDP and Control larvae. Scale bars = 100 μm. B Quantification of microglia cell number in whole-brain of Control versus CytoTDP larvae at 5 dpf and 8 dpf, 5 dpf Control vs 5 dpf CytoTDP ** p = 0.0012, 8 dpf Control vs 8 dpf * p = 0.0134, n = 10 larvae for each group, unpaired T test, Error bars indicates ± SD. C Quantification of microglia cell number in the hypothalamus of Control versus CytoTDP larvae at 5 dpf and 8 dpf, 5 dpf Control vs 5 dpf CytoTDP ** p = 0.0041, 8 dpf Control vs 8 dpf CytoTDP **** p < 0.0001, unpaired T test, n = 10 larvae for each group, Error bars indicates ± SD
|
