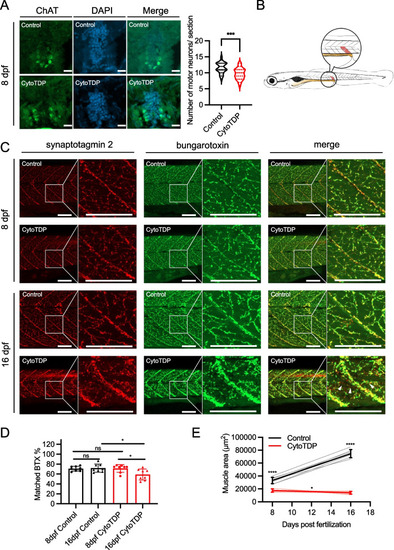
Reduction of motor neurons and NMJ degeneration in CytoTDP. A Representative images of ChAT stained 20 μm spinal cord sections from Control and CytoTDP at 8 dpf, scale bars = 20 μm. Quantification of ChAT-positive cells per 20 μm section of Control and CytoTDP at 8 dpf. Control vs CytoTDP *** p = 0.0001, unpaired T test, n = 30 sections for each group. B Schematic drawing of a 5 dpf old larva highlighting the last ventral half of the somite (red) before the end of the gut (yellow), which was used for quantifications. C Representative pictures of double whole-mount immunostainings for synaptotagmin 2 (presynaptic marker, red) and bungarotoxin (postsynaptic marker, green) highlighting the NMJ for CytoTDP and Control at 8 dpf and 16 dpf. CytoTDP and Control have similar NMJ structure at 8 dpf, while 16 dpf CytoTDP have misaligned presynaptic and postsynaptic staining indicative of a degenerated NMJ. Boxes indicate magnified area. Arrowheads in 16 dpf CytoTDP merge magnified image point to non-overlapping synaptotagmin 2 (red) and bungarotoxin (green) stainings. Scale bar = 150 µm. D Quantification of colocalized presynaptic and postsynaptic markers in the last ventral half of the somite before the end of the gut in CytoTDP and Control at 8 dpf and 16 dpf. Unpaired T test: 8 dpf Control vs 8 dpf CytoTDP p = 0.8819, 16 dpf Control vs 16 dpf CytoTDP * p = 0.0187, 8 dpf Control vs 16 dpf Control p = 0.7551, 8 dpf CytoTDP vs 16 dpf CytoTDP * p = 0.0215; each group n = 8; Error bars indicates ± SD. E Quantifications of musculature area of the last ventral half somite before the end of the gut in CytoTDP and Control fish at 8 dpf and 16 dpf. Unpaired T test: 8 dpf Control vs 8 dpf CytoTDP **** p < 0.0001, 16 dpf Control vs 16 dpf CytoTDP **** p < 0.0001, 8 dpf Control vs 16 dpf Control **** p < 0.0001, 8 dpf CytoTDP vs 16 dpf CytoTDP p = 0.0157; n = 7 larvae for each group. Error bars indicates ± SD
|
