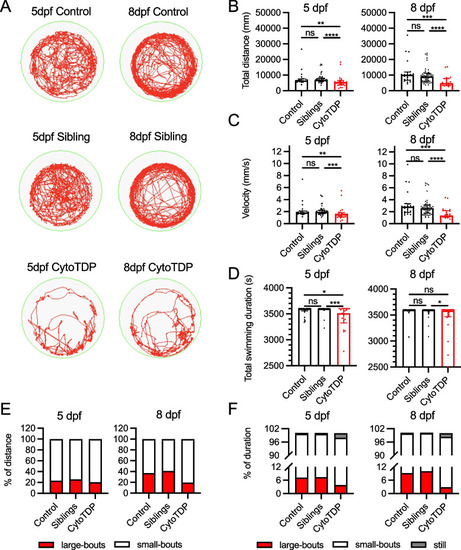
Age dependent movement phenotypes. A Representative locomotor activity path of 1 h video recordings (red path) of one larva of CytoTDP and its siblings [Siblings (tardbp ΔNLS/ + ; tardbpl -/-), Control (tardbp + / + ; tardbpl -/-)] at 5 dpf and 8 dpf. B-D Quantifications of total swimming distance, velocity and duration for CytoTDP (red dots) and its siblings [Siblings (black arrow heads): tardbp ΔNLS/ + ; tardbpl -/-, Control (black dots): tardbp + / + ; tardbpl -/-] at 5 dpf and 8 dpf. Kruskal–Wallis test was used for 3 groups comparisons and Mann–Whitney test was used for 2 groups comparisons. Error bars indicates ± interquartile range. Control n = 21, Siblings n = 50, CytoTDP n = 23. B Swimming distance [5 dpf (***p = 0.0003, Control vs Siblings p > 0.9999, Control vs CytoTDP ** p = 0.0044, Siblings vs CytoTDP **** p < 0.0001); 8 dpf (****p < 0.0001, Control vs Siblings p > 0.9999, Control vs CytoTDP *** p = 0.0002, Siblings vs CytoTDP **** p < 0.0001)]; C Swimming velocity [5 dpf (***p = 0.0006, Control vs Siblings p = 0.3192, Control vs CytoTDP ** p = 0.0052, Siblings vs CytoTDP **** p < 0.0001); 8 dpf (****p < 0.0001, Control vs Siblings p = 0.4565, Control vs CytoTDP *** p = 0.0001, Siblings vs CytoTDP **** p < 0.0001)] D Swimming duration [5 dpf (**p = 0.0032, Control vs Siblings p = 0.5607, Control vs CytoTDP * p = 0.0403, Siblings vs CytoTDP *** p = 0.0004); 8 dpf (p = 0.1043, Control vs Siblings p = 0.9375, Control vs CytoTDP p = 0.0959, Siblings vs CytoTDP * p = 0.0427)]. E 100% stacked bar graph showing mean distribution of small-bouts (white bar) and large-bouts (red bar) swimming distance percentages for CytoTDP, Siblings and Control at 5 dpf and 8 dpf F 100% stacked bar graph showing mean distribution of durations of small-bouts (white bar), large-bouts (red bar) and still time with no movement (grey bar) percentages of Control, Siblings and CytoTDP at 5 dpf and 8 dpf. Control n = 21, Siblings n = 50, CytoTDP n = 23
|
