IMAGE

Fig. 9

ID
ZDB-IMAGE-240623-9
Source
Figures for Hu et al., 2024
Image
Figure Caption

Fig. 9

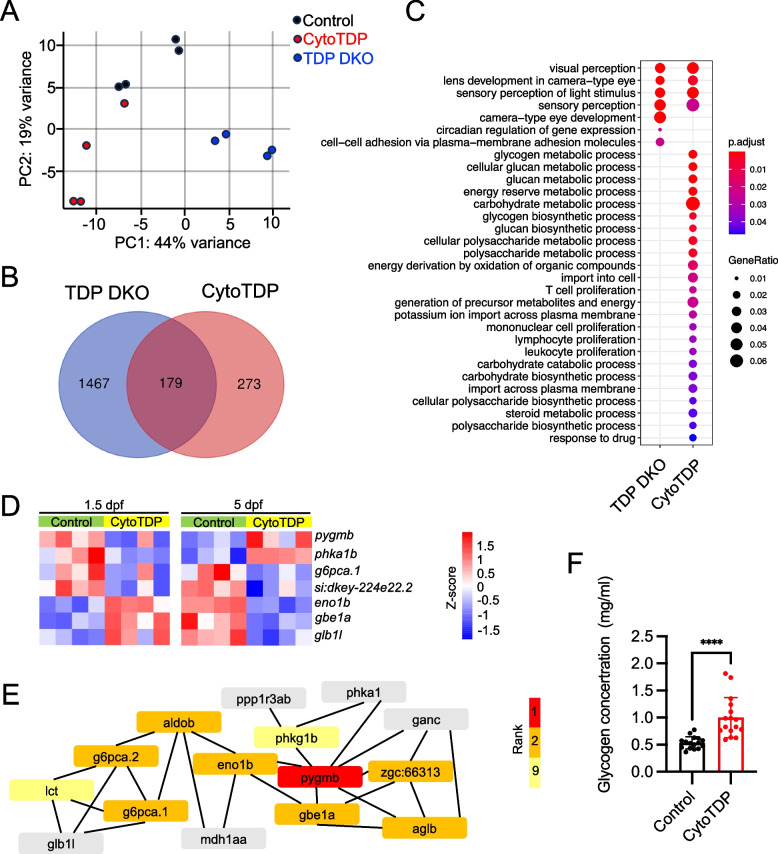
CytoTDP affects key metabolic processes. A Principal component analysis (PCA) of RNA sequencing results showed a strong separation of genotypes among the three groups of zebrafish (TDP DKO, CytoTDP and Control). B Venn diagram representation of the number of differentially expressed genes in TDP DKO (blue) and CytoTDP (red) compared to Control. C Gene ontology analysis of the biological process of genes differentially expressed of TDP DKO and CytoTDP compared to Control, respectively. D Heatmap of significantly mis-regulated genes in carbohydrate metabolic pathways in 1.5 dpf and 5 dpf CytoTDP fish. E Hub genes were identified through Cytoscape, with the color intensity representing the gene's ranking. F Quantification of glycogen concentrations revealed that the glycogen concentrations in 5 dpf CytoTDP embryos (n = 16) were 1.87 fold higher than in Control (n = 16) (****p < 0.0001, Unpaired T test)

Acknowledgments
This image is the copyrighted work of the attributed author or publisher, and ZFIN has permission only to display this image to its users. Additional permissions should be obtained from the applicable author or publisher of the image. Full text @ Mol. Neurodegener.