IMAGE

Fig. 7

ID
ZDB-IMAGE-240623-7
Source
Figures for Hu et al., 2024
Image
Figure Caption

Fig. 7

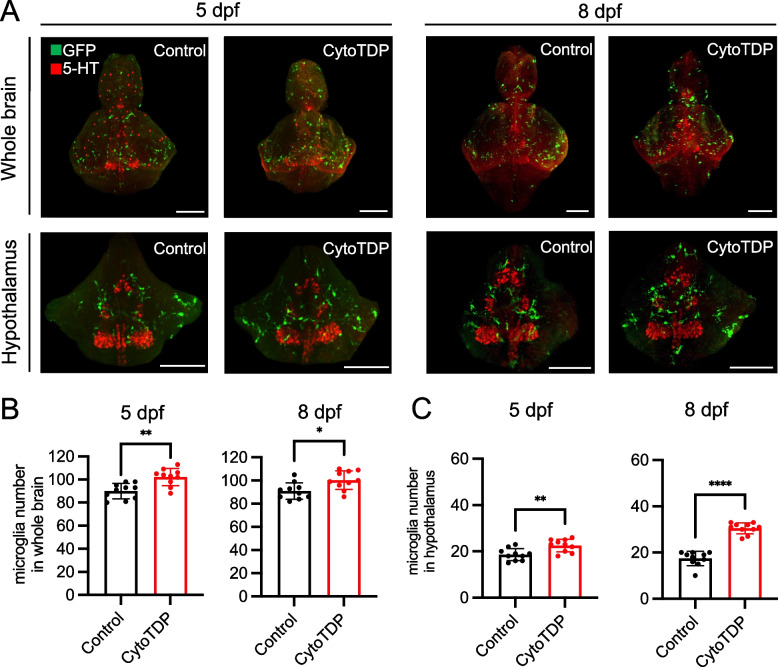
Microglia proliferation in the hypothalamus of CytoTDP. A Representative dorsal views of segmented whole-brain (top panel) and hypothalamus (lower panel) images using tissue clearing and whole-mount immunostaining of microglia at 5 dpf and 8 dpf. Co-staining against 5-hydroxytryptamine (5-HT) was used as a counterstain for the hypothalamus in zebrafish [38]. Confocal scans of mpeg1.1-eGFP positive microglia (green) and 5-HT (red) CytoTDP and Control larvae. Scale bars = 100 μm. B Quantification of microglia cell number in whole-brain of Control versus CytoTDP larvae at 5 dpf and 8 dpf, 5 dpf Control vs 5 dpf CytoTDP ** p = 0.0012, 8 dpf Control vs 8 dpf * p = 0.0134, n = 10 larvae for each group, unpaired T test, Error bars indicates ± SD. C Quantification of microglia cell number in the hypothalamus of Control versus CytoTDP larvae at 5 dpf and 8 dpf, 5 dpf Control vs 5 dpf CytoTDP ** p = 0.0041, 8 dpf Control vs 8 dpf CytoTDP **** p < 0.0001, unpaired T test, n = 10 larvae for each group, Error bars indicates ± SD

Acknowledgments
This image is the copyrighted work of the attributed author or publisher, and ZFIN has permission only to display this image to its users. Additional permissions should be obtained from the applicable author or publisher of the image. Full text @ Mol. Neurodegener.