IMAGE

Fig. 4

ID
ZDB-IMAGE-240623-4
Source
Figures for Hu et al., 2024
Image
Figure Caption

Fig. 4

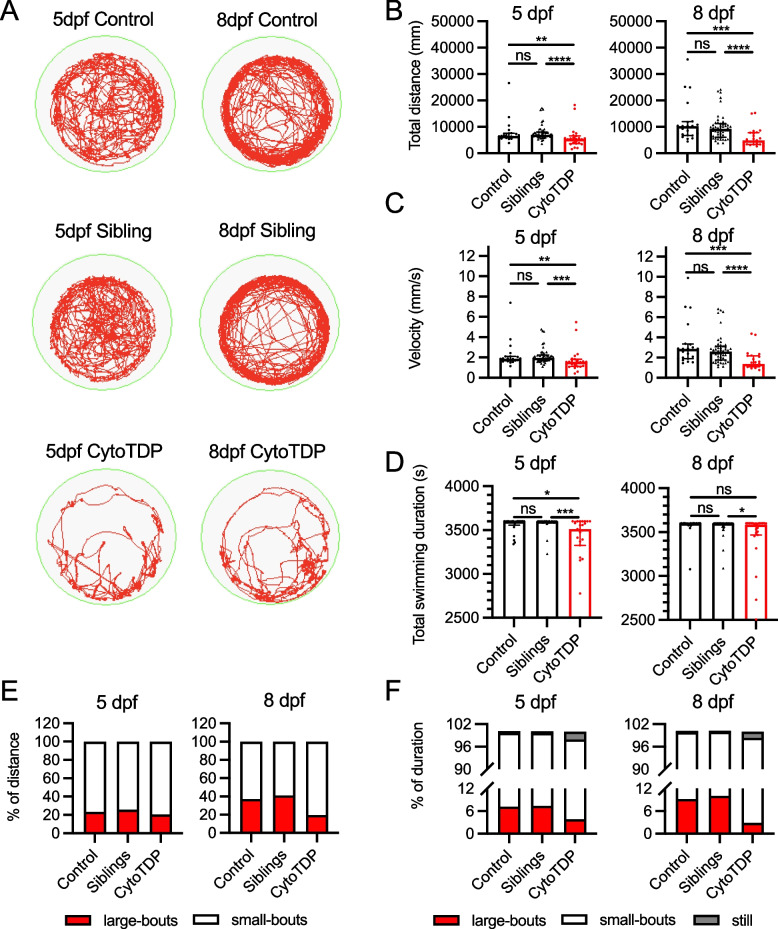
Age dependent movement phenotypes. A Representative locomotor activity path of 1 h video recordings (red path) of one larva of CytoTDP and its siblings [Siblings (tardbp ΔNLS/ + ; tardbpl -/-), Control (tardbp + / + ; tardbpl -/-)] at 5 dpf and 8 dpf. B-D Quantifications of total swimming distance, velocity and duration for CytoTDP (red dots) and its siblings [Siblings (black arrow heads): tardbp ΔNLS/ + ; tardbpl -/-, Control (black dots): tardbp + / + ; tardbpl -/-] at 5 dpf and 8 dpf. Kruskal–Wallis test was used for 3 groups comparisons and Mann–Whitney test was used for 2 groups comparisons. Error bars indicates ± interquartile range. Control n = 21, Siblings n = 50, CytoTDP n = 23. B Swimming distance [5 dpf (***p = 0.0003, Control vs Siblings p > 0.9999, Control vs CytoTDP ** p = 0.0044, Siblings vs CytoTDP **** p < 0.0001); 8 dpf (****p < 0.0001, Control vs Siblings p > 0.9999, Control vs CytoTDP *** p = 0.0002, Siblings vs CytoTDP **** p < 0.0001)]; C Swimming velocity [5 dpf (***p = 0.0006, Control vs Siblings p = 0.3192, Control vs CytoTDP ** p = 0.0052, Siblings vs CytoTDP **** p < 0.0001); 8 dpf (****p < 0.0001, Control vs Siblings p = 0.4565, Control vs CytoTDP *** p = 0.0001, Siblings vs CytoTDP **** p < 0.0001)] D Swimming duration [5 dpf (**p = 0.0032, Control vs Siblings p = 0.5607, Control vs CytoTDP * p = 0.0403, Siblings vs CytoTDP *** p = 0.0004); 8 dpf (p = 0.1043, Control vs Siblings p = 0.9375, Control vs CytoTDP p = 0.0959, Siblings vs CytoTDP * p = 0.0427)]. E 100% stacked bar graph showing mean distribution of small-bouts (white bar) and large-bouts (red bar) swimming distance percentages for CytoTDP, Siblings and Control at 5 dpf and 8 dpf F 100% stacked bar graph showing mean distribution of durations of small-bouts (white bar), large-bouts (red bar) and still time with no movement (grey bar) percentages of Control, Siblings and CytoTDP at 5 dpf and 8 dpf. Control n = 21, Siblings n = 50, CytoTDP n = 23

Acknowledgments
This image is the copyrighted work of the attributed author or publisher, and ZFIN has permission only to display this image to its users. Additional permissions should be obtained from the applicable author or publisher of the image. Full text @ Mol. Neurodegener.