FIGURE

Fig 2

ID
ZDB-FIG-240429-98
Publication
Schmidt et al., 2024 - Transcriptional control of visual neural circuit development by GS homeobox 1
Other Figures
All Figure Page
Back to All Figure Page
Fig 2

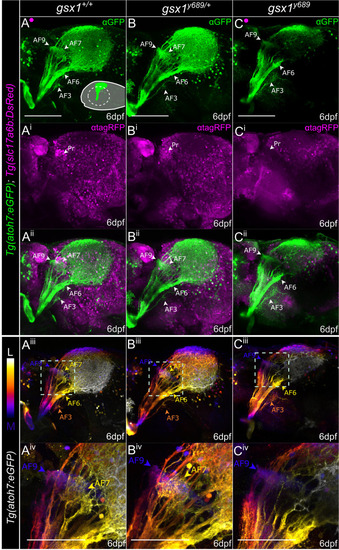
RGC axon termination is disrupted in gsx1y689.

(A-C) Max projections of confocal z-stacks through the optic tectum from start of Tg(atoh7:EGFP) (green, RGC axons) labeling to end in (A-Aii) wildtypes (~85μm), (B-Bii)gsx1y689/+ (~82μm), and (C-Cii)gsx1 mutants (~80μm). Tg(slc17a6b:DsRed) labels glutamatergic neurons (magenta), and white arrowhead, Pr, points to pretectal region lacking Tg(slc17a6b:DsRed) expression in gsx1y689. Schematic in (A) displays lateral orientation with dashed circle indicating removed eye. Scalebar = 100μm. (Aiii-Aiv, Biii-Biv, Ciii-Civ) Depth coded view of same samples in A-Cii to provide reference for some AF regions with color coordinated arrowheads for depth, AF9 = dark blue, AF7 = yellow, AF3 = orange, AF6 = yellow. (Aiv, Biv, Civ) Zoomed in view of the pretectal AFs from dashed outline box in Aiii, Biii, Ciii. Scalebar = 50μm. AF9 can be seen in blue across each genotype, while AF7 is absent in gsx1y689 as seen by loss of yellow depth indicator.

Expression Data

Expression Detail
Antibody Labeling
Phenotype Data

Phenotype Detail
Acknowledgments
This image is the copyrighted work of the attributed author or publisher, and ZFIN has permission only to display this image to its users. Additional permissions should be obtained from the applicable author or publisher of the image. Full text @ PLoS Genet.