FIGURE SUMMARY
Title

Transcriptional control of visual neural circuit development by GS homeobox 1

Authors
Schmidt, A.R., Placer, H.J., Muhammad, I.M., Shephard, R., Patrick, R.L., Saurborn, T., Horstick, E.J., Bergeron, S.A.
Source
Full text @ PLoS Genet.

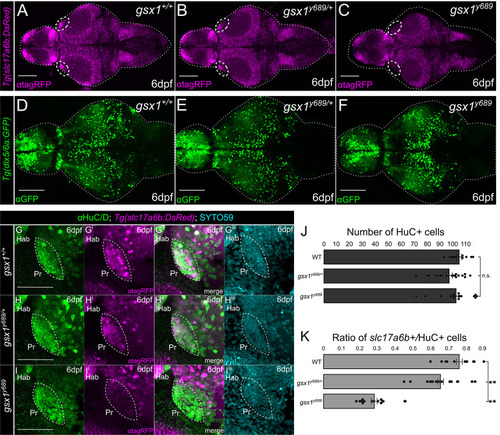
Examining excitatory and inhibitory neuron differentiation in gsx1y689.

(A-F) Max projections of confocal z-stacks of Tg(slc17a6b:DsRed) and Tg(dlx5a/6a:GFP) at 6 dpf in gsx1+/+ (wildtypes), gsx1y689/+ (heterozygotes), and gsx1y689 (mutants). Scalebar = 100μm. White dashed oval (A-C) outlines pretectal region missing slc17a6b in gsx1y689. (G-Iiii) Max projection of confocal z-stacks (~20μm) of pretectal region using Tg(slc17a6b:DsRed) (magenta) and HuC/D antibody (neurons, green) at 6 dpf. Cyan = SYTO59, nuclei. Scalebar = 50μm. (J) Bar graph with no significant differences found in total number of pretectal neurons by assessing HuC/D and SYTO59 staining across genotypes (single factor ANOVA F(2,43) = 2.05, p = 0.14). (K) Bar graph of average percentage of Pr slc17a6b-positive neuron counts out of HuC/D positive cell counts, gsx1+/+ (n = 11), gsx1y689/+ (n = 19), gsx1y689 (n = 16), F(2,43) = 3.21, p < .001. Post-hoc analysis of single factor ANOVA revealed slc17a6b/HuC/D ratio for gsx1+/+ (79.72 ± 2.64) is significantly different from gsx1y689/+ (63.95 ± 2.92, p<0.001) and gsx1y689 (28.63±1.7, p<0.001). There is also a statistically significant difference between slc17a6b/HuC/D ratios in gsx1y689/+ and gsx1y689 (p<0.001). Power factor greater than 80% for all genotypes, p<0.05.

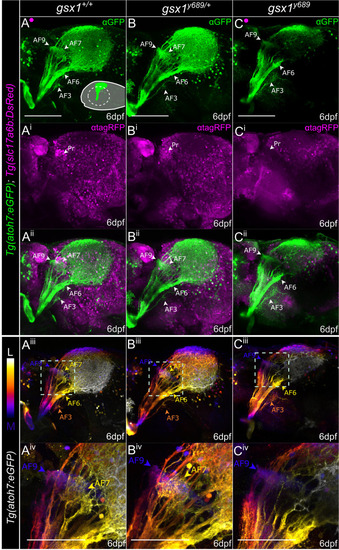
RGC axon termination is disrupted in gsx1y689.

(A-C) Max projections of confocal z-stacks through the optic tectum from start of Tg(atoh7:EGFP) (green, RGC axons) labeling to end in (A-Aii) wildtypes (~85μm), (B-Bii)gsx1y689/+ (~82μm), and (C-Cii)gsx1 mutants (~80μm). Tg(slc17a6b:DsRed) labels glutamatergic neurons (magenta), and white arrowhead, Pr, points to pretectal region lacking Tg(slc17a6b:DsRed) expression in gsx1y689. Schematic in (A) displays lateral orientation with dashed circle indicating removed eye. Scalebar = 100μm. (Aiii-Aiv, Biii-Biv, Ciii-Civ) Depth coded view of same samples in A-Cii to provide reference for some AF regions with color coordinated arrowheads for depth, AF9 = dark blue, AF7 = yellow, AF3 = orange, AF6 = yellow. (Aiv, Biv, Civ) Zoomed in view of the pretectal AFs from dashed outline box in Aiii, Biii, Ciii. Scalebar = 50μm. AF9 can be seen in blue across each genotype, while AF7 is absent in gsx1y689 as seen by loss of yellow depth indicator.

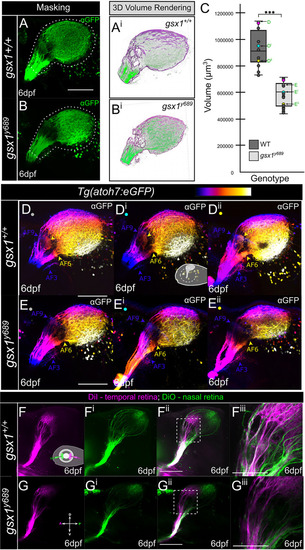
RGC axon volume and trajectory examination in gsx1 mutants.

(A) Example max projection of a confocal z-stack in wildtype and (B)gsx1y689, with Tg(atoh7:eGFP) anti-GFP labeling. Dashes around axons indicates regions of interest and mask application. (Ai-Bi) Example 3D volume rendering taken from Imaris when Labkit is used. (C) Box and whisker plot with individual data points included for volumes. There was a significant difference in volume of RGC axons between wildtype (M = 904100.00μm3, SD = 134984.32, SEM = 42685.79μm3, n = 10) and gsx1 mutants (M = 564000.00μm3, SD = 80067.47, SEM = 24141.25μm3, n = 11); t(19) = 7.1, p < 0.001. Post-hoc power analysis = 100%. Colored dots correspond to Fig 2 images (magenta), and D-Eii representative minimum (yellow), maximum (light gray), and average (cyan) axon volume images. (D-Dii) Wildtype and (E-Eii) mutant RGC axon images that have been depth color coded to show AF9 in blue as the deepest AF. These images represent the RGC axon phenotype variability in wildtypes and mutants as indicated in panel C. (F-Giii) Max projection of confocal z-stacks in wildtypes (F-Fiii) and gsx1y689(G-Giii), with DiI (magenta) injected into the temporal retina and DiO (green) injected into the nasal retina. Scalebar = 100μm. (Fiiiand Giii) Zoomed in pretectal region with consistent loss of AF7 in gsx1y689. Scalebar = 50μm.

gsx1 mutants have disrupted prey capture and normal light-mediated turn bias.

(A- Aiii) Experimental setup for prey capture assay; eight 7 dpf larvae per 6 cm dish, except in controls (no larvae). (B) Bar graph depicts rotifer/mL average across each group with individual data points showing all trials color coded (cyan, black, and orange) (n = 3) for controls (n = 7 dishes), wildtypes (n = 9 dishes), and gsx1y689 (n = 9 dishes); pre-feeding (dark grey bars), post-feeding (light grey bars). Power analysis revealed 100% for each condition, p<0.05. gsx1+/+ post count of rotifers/mL were statistically different from controls and gsx1y689, (F(2,24) = [3.44], p<0.001). Error bars displayed as ±SEM. No significant differences found between control and gsx1y689 post-feeding count analysis, p = 0.63. (C-F) Motor features extracted from the same pool of behavior tested larvae (n = 53 gsx1+ light grey bars, n = 65 gsx1y689/+ yellow bars, n = 21 gsx1y689 dark grey bars. Data collected from four independent clutches. (C) Schematic of recording field of view for turn bias assay. Four individual larvae recorded simultaneously. Not to scale (top). Light series during recordings showing light on (yellow) and light off (black) intervals. Scale bar represents a 30 second time period (middle). Representative traces during light on and off periods (bottom). (D) Match index during light on and dark trials (noted on the y-axis). Circle asterisk denotes p < 0.05 using a one-way Wilcoxon Signed Rank test to 0.5 representing random turn bias (shown with dotted red line). (E-F) Total turn angle and fractal dimension, representing other dark response motor features. * shows T test between light and dark responses for each genotype. Black circles show individual larva datapoints. Error bars displayed as ±SEM.

Tg(slc17a6b)-positive pretectal neurons are required for AF7 formation.

(A) Experimental timeline: gsx1+/+;Tg(slc17a6b:DsRed);Tg(atoh7:eGFP) were raised until 72 hpf when they undergo unilateral ablation of the right pretectal (RPr) region. An acridine orange (AO) assay is performed on some samples at 72 hpf, hours post-ablation. Other ablated samples recover until 7 dpf. At 7 dpf samples are fixed and further undergo immunohistochemistry (IHC). (B) Schematic of unilateral RPr ablation in gsx1+/+;Tg(slc17a6b:DsRed);Tg(atoh7:eGFP) (magenta and green, respectively) at 72 hpf. LPr = left pretectum. (C-Cii) Pre-ablation of 72 hpf max projection of 2-photon z-stack through RPr separated by individual channels of Tg(atoh7:eGFP), green, Tg(slc17a6b:DsRed), magenta, and merged image channels. Two ablation sites are targeted and shown in C, red boxes. Dashed white outline indicates pretectal region. Orientation of sample is in right top corner. Scalebar = 50μm. (D-Dii) Post RPr ablation of same sample in C-Cii at 72 hpf, red arrows indicate displacement of the fluorescent proteins. (E) Schematic of imaging planes in black dashed boxes after unilateral RPr ablation and then following AO staining. (F-Gii) AO staining compared to intact LPr in the same RPr ablated sample, using Tg(slc17a6b:DsRed) (magenta) while red arrowheads indicate increased acridine orange (green) in ablated side. (H) Bar graph of quantified slc17a6b-positive neurons at 7 dpf in the LPr and RPr following 72 hpf RPr ablation. The ablated RPr showed statistically significant decreases in slc17a6b-positive neurons compared to LPr side (n = 7), t(13) = 0.96, p<0.001. (I-Kiv) Lateral 7 dpf max projections of confocal z-stacks of RGC axons in Tg(atoh7:eGFP) and Tg(slc17a6b:DsRed) and the same images depth color coded from medial (blue) to lateral (white), providing AF visualization, blue = AF9, yellow = AF7. Scalebar = 100μm. (I-Iiv) Control (no ablation, n = 6), orientation schematic in right bottom corner. (J-Jiv) 72 hpf unilateral RPr ablated resulting in partial AF7 disruption at 7 dpf (n = 7/11). (K-Kiv) 72 hpf unilateral RPr ablated resulting in total AF7 disruption at 7 dpf (n = 4/11). (Iiv, Jiv, Kiv) Zoomed in image from adjacent images with white dashed boxes for visualization of RGC axon AF patterns. Scalebar = 50μm.

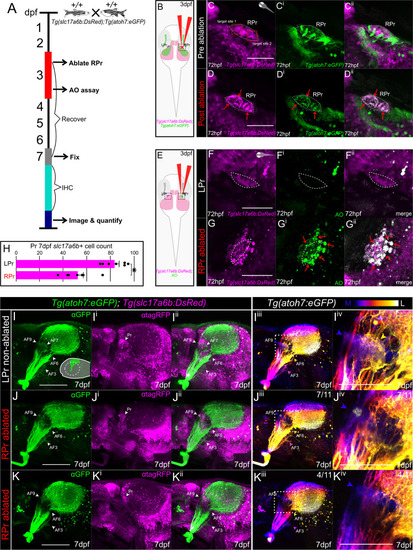
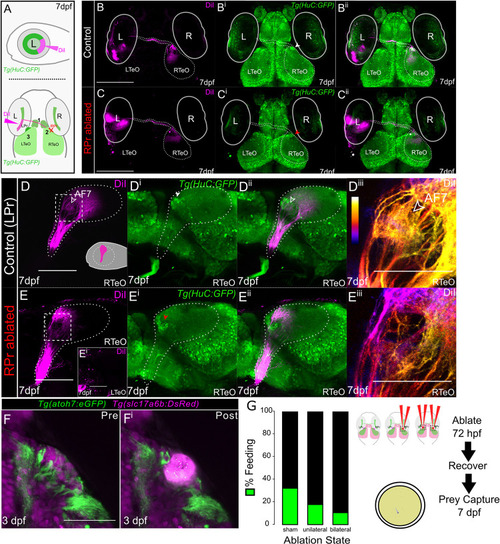
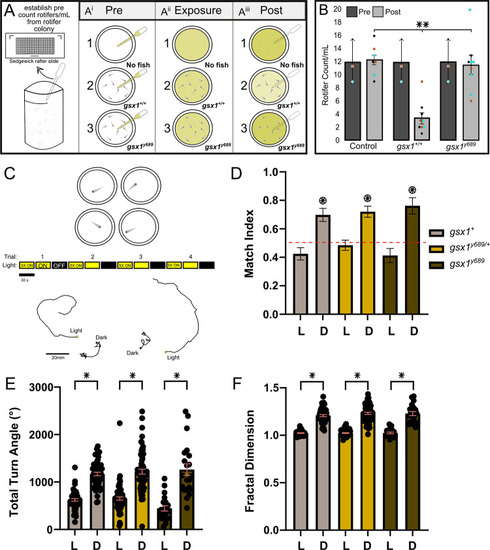
Retinotopographic order and prey capture defect is confirmed after pretectal ablations in the AF7 region.
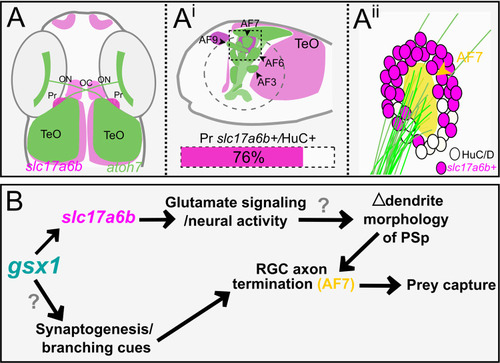
(A) Schematics indicating orientation and location of left eye (L) DiI injections and areas of RGC axon examination to the contralateral right TeO/Pr. Three black numbers indicate regions to examine labeling after ablation; 1) optic chiasm crossing, 2) anterior tectal labeling on contralateral lobe from injection, and 3) wandering DiI labeled RGC axons (left optic tectum = LTeO). R = right eye. (B-Bii) Max projections of 2-photon z-stacks (~200μm) in control non-ablated samples at 7 dpf (n = 10). DiI = magenta, green = Tg(HuC/D:GFP). (C-Cii) Unilateral RPr ablations in Tg(HuC/D:GFP) wildtypes at 72 hpf, fixed at 7 dpf and DiI injected in temporal retina. Max projections of 2-photon z-stacks show proper optic chiasm crossing, anterior RGC axon arborization, and no RGC axons are seen targeting beyond the anterior contralateral tectum (n = 11). Red arrowhead indicates RPr that was ablated at 72 hpf. Scalebar = 200μm. (D-Diii) Max projection of confocal z-stacks of RTeO in lateral orientation showing DiI labeling in control (LPr) non-ablated samples (n = 5), (~85μm). Schematic of left eye DiI injection in D. White arrowhead indicates RPr region and red arrowhead indicates ablated RPr region. Scalebar = 100μm. (E-Eiii) Lateral orientation with left eye removed of max projected confocal z-stacks of a RPr ablated sample and DiI labeling in RTeO (~85μm). (Diii, Eiii) DiI image from D and E in white dashed box is depth color coded from medial (blue) to lateral (white) and zoomed in showing loss of AF7 (yellow). Scalebar = 50μm. (F-Fi) Pre and post ablation images taken of the RPr in 72 hpf embryos used at 7 dpf for prey capture behavior. (H) After four days of recovery sham (n = 31), unilateral (n = 28), and bilateral (n = 28) ablated larvae were tested individually for prey capture behavior showing that sham ablated individuals ate significantly more often than bilaterally ablated individuals (sham to unilateral, x2(1) = 1.609, p = 0.2046; sham to bilateral, x2(1) = 3.975, p = 0.0462).

A model for gsx1 function in the visual system.

(A) Summary schematic of Tg(slc17a6b:DsRed) expression (magenta) and RGC axon patterning via Tg(atoh7:eGFP) expression (green) at 6 dpf in wildtypes (gsx1+/+). (Ai) Lateral view of the TeO and pretectal arborization fields (AFs) (adapted from (20)) with Tg(slc17a6b:DsRed) expression (magenta). Wildtype pretectal Tg(slc17a6b)/HuC/D+ cell ratio is shown with magenta bar. (Aii) Zoomed in schematic of RGC axons for AF7 surrounded by Tg(slc17a6b:DsRed)-positive cells from the outlined box in Ai. (B) Model of how gsx1 contributes to pretectal neuronal identity and neural circuit assembly. Parvocellular superficial pretectal nucleus (PSp).

Acknowledgments
This image is the copyrighted work of the attributed author or publisher, and ZFIN has permission only to display this image to its users. Additional permissions should be obtained from the applicable author or publisher of the image. Full text @ PLoS Genet.