FIGURE

Fig 1

ID
ZDB-FIG-240429-97
Publication
Schmidt et al., 2024 - Transcriptional control of visual neural circuit development by GS homeobox 1
Other Figures
All Figure Page
Back to All Figure Page
Fig 1

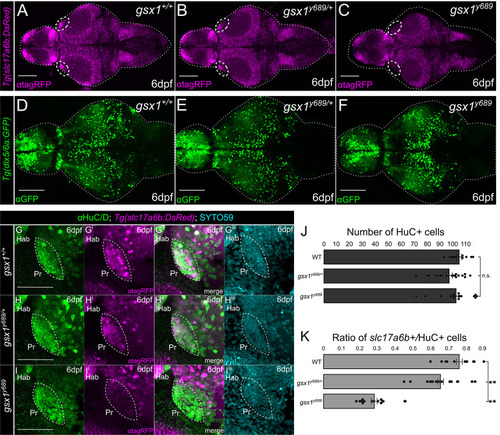
Examining excitatory and inhibitory neuron differentiation in gsx1y689.

(A-F) Max projections of confocal z-stacks of Tg(slc17a6b:DsRed) and Tg(dlx5a/6a:GFP) at 6 dpf in gsx1+/+ (wildtypes), gsx1y689/+ (heterozygotes), and gsx1y689 (mutants). Scalebar = 100μm. White dashed oval (A-C) outlines pretectal region missing slc17a6b in gsx1y689. (G-Iiii) Max projection of confocal z-stacks (~20μm) of pretectal region using Tg(slc17a6b:DsRed) (magenta) and HuC/D antibody (neurons, green) at 6 dpf. Cyan = SYTO59, nuclei. Scalebar = 50μm. (J) Bar graph with no significant differences found in total number of pretectal neurons by assessing HuC/D and SYTO59 staining across genotypes (single factor ANOVA F(2,43) = 2.05, p = 0.14). (K) Bar graph of average percentage of Pr slc17a6b-positive neuron counts out of HuC/D positive cell counts, gsx1+/+ (n = 11), gsx1y689/+ (n = 19), gsx1y689 (n = 16), F(2,43) = 3.21, p < .001. Post-hoc analysis of single factor ANOVA revealed slc17a6b/HuC/D ratio for gsx1+/+ (79.72 ± 2.64) is significantly different from gsx1y689/+ (63.95 ± 2.92, p<0.001) and gsx1y689 (28.63±1.7, p<0.001). There is also a statistically significant difference between slc17a6b/HuC/D ratios in gsx1y689/+ and gsx1y689 (p<0.001). Power factor greater than 80% for all genotypes, p<0.05.

Expression Data

Expression Detail
Antibody Labeling
Phenotype Data

Phenotype Detail
Acknowledgments
This image is the copyrighted work of the attributed author or publisher, and ZFIN has permission only to display this image to its users. Additional permissions should be obtained from the applicable author or publisher of the image. Full text @ PLoS Genet.