|
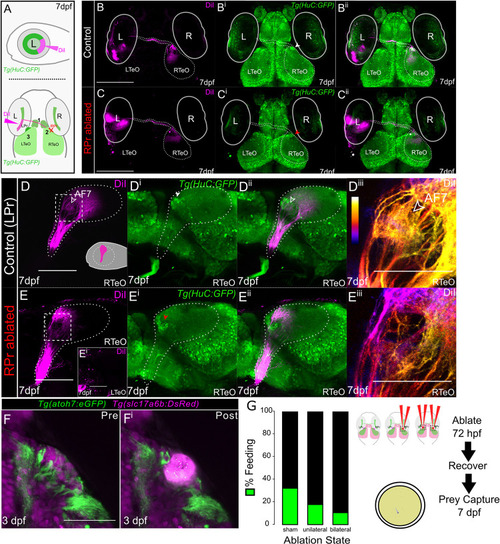
Retinotopographic order and prey capture defect is confirmed after pretectal ablations in the AF7 region. (A) Schematics indicating orientation and location of left eye (L) DiI injections and areas of RGC axon examination to the contralateral right TeO/Pr. Three black numbers indicate regions to examine labeling after ablation; 1) optic chiasm crossing, 2) anterior tectal labeling on contralateral lobe from injection, and 3) wandering DiI labeled RGC axons (left optic tectum = LTeO). R = right eye. (B-Bii) Max projections of 2-photon z-stacks (~200μm) in control non-ablated samples at 7 dpf (n = 10). DiI = magenta, green = Tg(HuC/D:GFP). (C-Cii) Unilateral RPr ablations in Tg(HuC/D:GFP) wildtypes at 72 hpf, fixed at 7 dpf and DiI injected in temporal retina. Max projections of 2-photon z-stacks show proper optic chiasm crossing, anterior RGC axon arborization, and no RGC axons are seen targeting beyond the anterior contralateral tectum (n = 11). Red arrowhead indicates RPr that was ablated at 72 hpf. Scalebar = 200μm. (D-Diii) Max projection of confocal z-stacks of RTeO in lateral orientation showing DiI labeling in control (LPr) non-ablated samples (n = 5), (~85μm). Schematic of left eye DiI injection in D. White arrowhead indicates RPr region and red arrowhead indicates ablated RPr region. Scalebar = 100μm. (E-Eiii) Lateral orientation with left eye removed of max projected confocal z-stacks of a RPr ablated sample and DiI labeling in RTeO (~85μm). (Diii, Eiii) DiI image from D and E in white dashed box is depth color coded from medial (blue) to lateral (white) and zoomed in showing loss of AF7 (yellow). Scalebar = 50μm. (F-Fi) Pre and post ablation images taken of the RPr in 72 hpf embryos used at 7 dpf for prey capture behavior. (H) After four days of recovery sham (n = 31), unilateral (n = 28), and bilateral (n = 28) ablated larvae were tested individually for prey capture behavior showing that sham ablated individuals ate significantly more often than bilaterally ablated individuals (sham to unilateral, x2(1) = 1.609, p = 0.2046; sham to bilateral, x2(1) = 3.975, p = 0.0462).
|