|
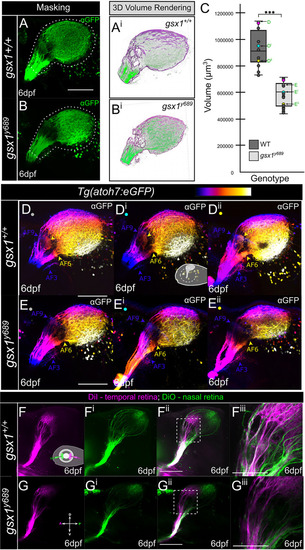
RGC axon volume and trajectory examination in gsx1 mutants. (A) Example max projection of a confocal z-stack in wildtype and (B)gsx1y689, with Tg(atoh7:eGFP) anti-GFP labeling. Dashes around axons indicates regions of interest and mask application. (Ai-Bi) Example 3D volume rendering taken from Imaris when Labkit is used. (C) Box and whisker plot with individual data points included for volumes. There was a significant difference in volume of RGC axons between wildtype (M = 904100.00μm3, SD = 134984.32, SEM = 42685.79μm3, n = 10) and gsx1 mutants (M = 564000.00μm3, SD = 80067.47, SEM = 24141.25μm3, n = 11); t(19) = 7.1, p < 0.001. Post-hoc power analysis = 100%. Colored dots correspond to Fig 2 images (magenta), and D-Eii representative minimum (yellow), maximum (light gray), and average (cyan) axon volume images. (D-Dii) Wildtype and (E-Eii) mutant RGC axon images that have been depth color coded to show AF9 in blue as the deepest AF. These images represent the RGC axon phenotype variability in wildtypes and mutants as indicated in panel C. (F-Giii) Max projection of confocal z-stacks in wildtypes (F-Fiii) and gsx1y689(G-Giii), with DiI (magenta) injected into the temporal retina and DiO (green) injected into the nasal retina. Scalebar = 100μm. (Fiiiand Giii) Zoomed in pretectal region with consistent loss of AF7 in gsx1y689. Scalebar = 50μm.
|