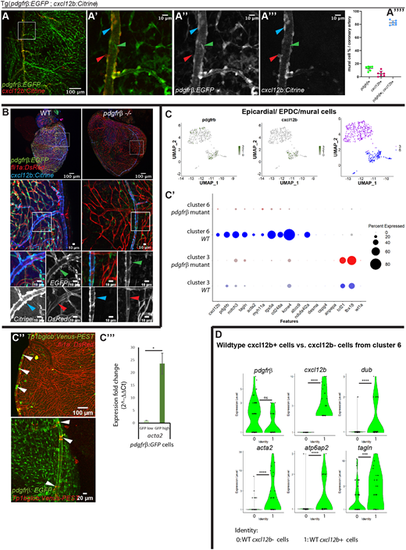
pdgfrb+;cxcl12b+ arterial mural cells are smooth muscle-like and they remain associated with endothelial cells in the pdgfrb mutant. (A-A″″) The majority of the pdgfrb+ mural cells express cxcl12b on the large, narrow vessels (coronary artery). (A-A‴). On the main trunk of the coronary artery, most pdgfrb:EGFP+ mural cells (green) express cxcl12b:Citrine (blue arrowheads). A few mural cells only express pdgfrb (green arrowheads) or cxcl12b (red arrowheads). cxcl12b expression in the pdgfrb+ mural cells gradually decrease on the branches away from the main coronary artery (A‴). A′-A‴ show enlarged views of the boxed area in A. (A″″) Quantification of pdgfrb+;cxcl12b+ (∼82.4% of the mural cells on the coronary artery), pdgfrb+ only (∼12.9%) and cxcl12b+ only (∼4.7%) mural cells (n=5 hearts, 1-2 coronary arteries in each heart, 20× confocal images used for quantification). (B) In pdgfrb−/−, pdgfrb:EGFP- and cxcl12b:Citrine-expressing mural cells remain associated with the coronary artery whereas other vessels lose mural cell association. Boxed areas are enlarged and shown as single-channel images beneath. (C-C‴) Differentially expressed genes between pdgfrb mutant and WT in cluster 3 (EPDC) and cluster 6 (mural cell). (C) FACS-isolated pdgfrb:EGFP+ EPDCs and mural cells form two distinct clusters. The UMAP plot shows that cells in both clusters express pdgfrb and only one cluster expresses cxcl12b. (C′) Dot plot showing differentially expressed smooth muscle cell (tagln, acta2, myh11a), mural cell (pdgfrb, notch3 rgs5a, cd248a, kcne4, ndufa4l2a), epicardial (tcf21, tbx18) and cxcl12 genes in cluster 3 and cluster 6 of pdgfrb mutant and WT. Differentially expressed genes were determined with minimum percentage expression cut-off=0.1 and minimum average log fold change=0.25, adjusted P-value≤0.001 comparing cluster 6 versus cluster 3 and P-value≤0.05 for pdgfrb, notch3, tagln, rgs5a, cd248a and kcne4 comparing pdgfrb mutants and WT. (C″) Notch activities in coronary arterial mural cells, reflecting nocth3 expression (white arrowheads). (C‴) qRT-PCR of acta2 in GFP high (pdgfrb+; cxcl12b+) versus GFP low (pdgfrb+ only) cells. *P≤0.05 [one-sample (one-tailed) t-test]. (D) Violin plots of differentially expressed genes in WT cxcl12b+ cells compared with cxcl12b− cells of cluster 6. 0=WT cxcl12b− cells, 1=WT cxcl12b+ cells (average log fold change>0.8 except for pdgfrb+). ***P≤0.001, ****P≤0.0001 (non-parametric Wilcoxon rank sum test). N.S., not significant (P>0.05).
|
