
Fig 5
- ID
- ZDB-FIG-230526-59
- Publication
- Aljiboury et al., 2023 - Rab8, Rab11, and Rab35 coordinate lumen and cilia formation during zebrafish left-right organizer development
- Other Figures
- All Figure Page
- Back to All Figure Page
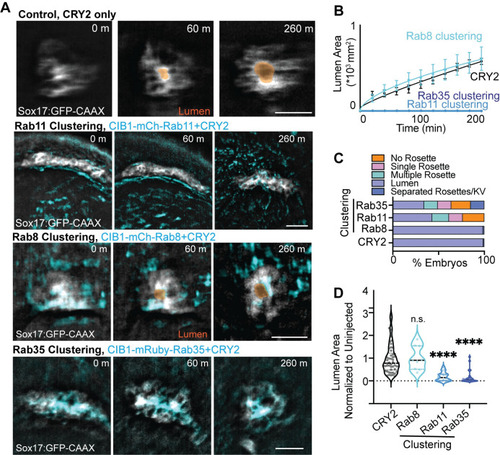
(A) Optogenetic clustering of Rab11 and Rab35 blocks KV lumen formation compared to CRY2 control and Rab8. Imaged on an automated fluorescent stereoscope. Scale bar, 50 μm. KV marked with Sox17:GFP-CAAX, lumens highlighted in orange, clusters shown in cyan. Refer to S3 Video. (B) KV lumen area over time (±SEM for n = 3 embryos per condition) in control (CRY2 injection) and Rab8, Rab11 and Rab35 clustering conditions. (C) KV morphologies characterized from optogenetically-clustered then fixed embryos at 12 SS (12 hpf). n>47 embryos per condition measured across n>9 clutches. (D) Violin plot depicting lumen area from Rab8, Rab11, and Rab35 clustering conditions normalized to uninjected control values. Dots represent individual KV values. Median denoted by line. One-way ANOVA with Dunnett’s multiple comparison test, compared to CRY2. n>9 embryos, n.s. not significant, ****p<0.0001. Statistical results detailed in S1 Table. |