
Fig 4
- ID
- ZDB-FIG-230526-58
- Publication
- Aljiboury et al., 2023 - Rab8, Rab11, and Rab35 coordinate lumen and cilia formation during zebrafish left-right organizer development
- Other Figures
- All Figure Page
- Back to All Figure Page
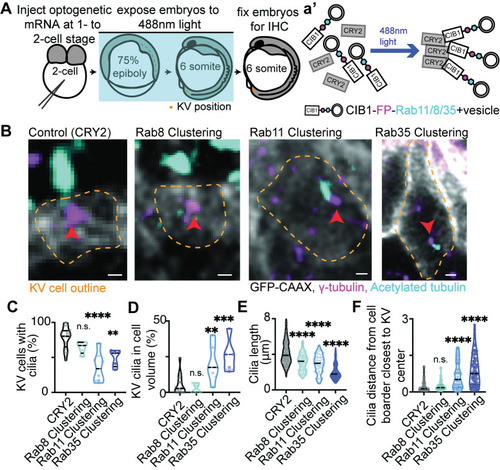
(A) A model depicting the use of optogenetics to acutely block Rab GTPase-associated trafficking events during KV developmental stages. (B) Confocal micrographs of cilia (acetylated tubulin, cyan) in CRY2 (control), Rab8-, Rab11-, and Rab35-clustered Sox17:GFP-CAAX embryos (gray). Centrosomes denoted by γ-tubulin (magenta). Clusters not shown. Yellow dashed lines are KV cell cortical membranes. Orange arrow, centrosome. Scale bar, 2μm. (C-F) Violin plots of percentage of KV cells with cilia (C), percentage of KV cilia in cell volume (D), cilia length (E), and the relative distance of cilia from the cell boarder closest to KV center (F). One way ANOVA with Dunnett’s multiple comparison to CRY2 (control) was performed. n>4 embryos, n.s. not significant, **p<0.01, ***p<0.001, ****p<0.0001. Statistical results detailed in S1 Table. |