
|
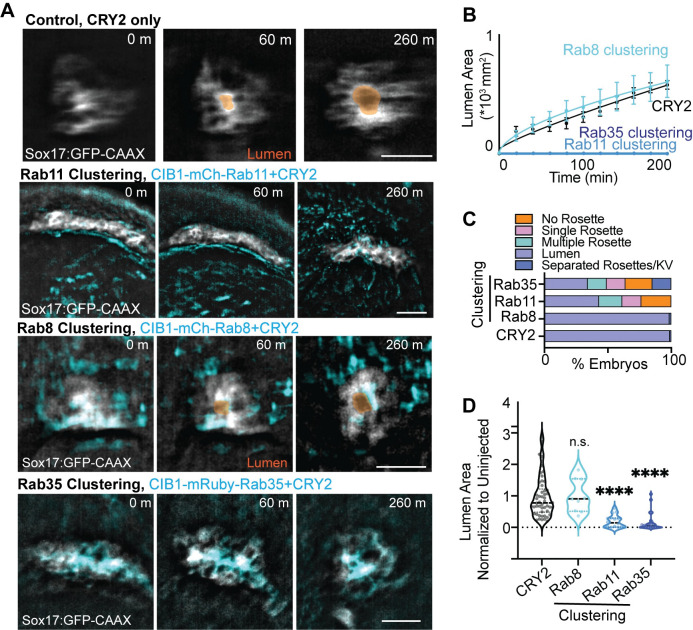
Fig 5
(A) Optogenetic clustering of Rab11 and Rab35 blocks KV lumen formation compared to CRY2 control and Rab8. Imaged on an automated fluorescent stereoscope. Scale bar, 50 μm. KV marked with Sox17:GFP-CAAX, lumens highlighted in orange, clusters shown in cyan. Refer to S3 Video. (B) KV lumen area over time (±SEM for n = 3 embryos per condition) in control (CRY2 injection) and Rab8, Rab11 and Rab35 clustering conditions. (C) KV morphologies characterized from optogenetically-clustered then fixed embryos at 12 SS (12 hpf). n>47 embryos per condition measured across n>9 clutches. (D) Violin plot depicting lumen area from Rab8, Rab11, and Rab35 clustering conditions normalized to uninjected control values. Dots represent individual KV values. Median denoted by line. One-way ANOVA with Dunnett’s multiple comparison test, compared to CRY2. n>9 embryos, n.s. not significant, ****p<0.0001. Statistical results detailed in S1 Table.