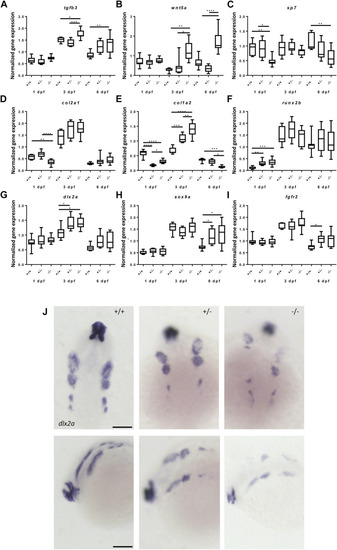
Gene expression of cartilage and bone (precursor) cells is affected in foxe1 mutants. (A-I) Relative gene expression of tgfβ3, wnt5a, sp7, col2a1, col1a2, runx2b, dlx2a, sox9a and fgfr2 in mutants versus wild types. Axis description from (A) applies to all graphs. (J) dlx2a positive post migratory neural crest cells at 24 hpf (Prim-5) in wild types, 20% of the heterozygous- and 60% of the homozygous mutants. Asterisks indicate the level of significance: * = p< 0.05, ** = p< 0.01, *** = p< 0.001, **** = p< 0.0001 (n = 10–15). Data were assessed for normality with the D’Agostino-Pearson normality test. Normally distributed data were analyzed using a one-way ANOVA and post-hoc Tukey test. Non-parametric data were compared with a Kruskal–Wallis test with post-hoc Dunn’s Multiple comparison test. Error bars indicate standard deviation. Scale bar 100 µm.