
Figure 3
- ID
- ZDB-FIG-230228-50
- Publication
- Nakamura et al., 2023 - Cerebrospinal fluid-contacting neuron tracing reveals structural and functional connectivity for locomotion in the mouse spinal cord
- Other Figures
- All Figure Page
- Back to All Figure Page
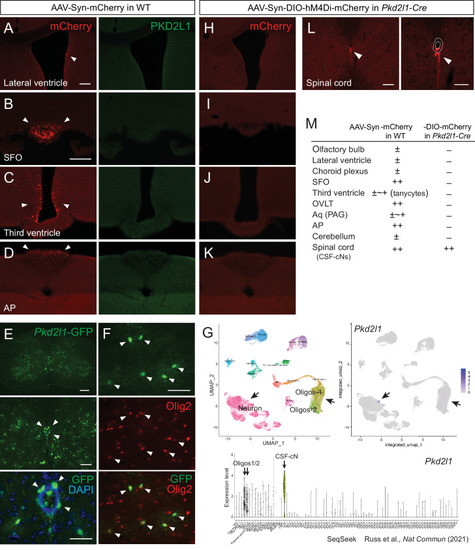
(A–D) mCherry labeled cells (red, arrowheads) in the lateral ventricle (A), SFO (B), third ventricle (C), and AP (D) following AAV-Syn-mCherry intracerebroventricular injection into wild-type (WT) mice. No PKD2L1 expression (green) was observed in these regions. (E, F) GFP+ signals in the CSF-cNs (E), green, arrowheads and Olig2+ oligodendrocytes (F), red, arrowheads in the spinal cord of an adult Pkd2l1-Cre;CAG-lcl-EGFP mouse. 4′,6-diamidino-2-phenylindole (DAPI), blue. (G) Single-cell/nucleus RNA-seq data in SeqSeek database (https://seqseek.ninds.nih.gov/home, Russ et al., 2021) represent Pkd2l1 mRNA expression in CSF-cNs and a subpopulation of oligodendrocytes. Upper panels show a uniform manifold approximation and projection (UMAP) plot of spinal cord single-cell/nucleus RNA-seq data (left), and feature plots highlight Pkd2l1 expression in spinal cells (violet, right). The bottom panel depicts violin plots representing Pkd2l1 expression levels in spinal cell types. (H–K) mCherry-labeled cells (red, arrowheads) in the lateral ventricle (H), SFO (I), third ventricle (J), AP (K), and cervical cord (L) following AAV-Syn-DIO-hM4Di-mCherry intracerebroventricular injection into Pkd2l1-Cre mice. The right image of (L) is a higher magnification view around the central canal (dotted lines). (M) Summary of AAV-Syn-mCherry and -DIO-hM4Di-mCherry-labeled cells in the brain and spinal cord of WT and Pkd2l1-Cre mice, respectively. Scale bars, 100 µm (A, B); 200, 100, 50 µm (upper to bottom in E); 50 µm (F); 100, 50 µm (left, right in L). AP, area postrema; Aq, cerebral aqueduct; OVLT, vascular organ of the lamina terminalis; PAG, periaqueductal gray; SFO, subfornical organ.
|