
Figure 2
- ID
- ZDB-FIG-230228-48
- Publication
- Nakamura et al., 2023 - Cerebrospinal fluid-contacting neuron tracing reveals structural and functional connectivity for locomotion in the mouse spinal cord
- Other Figures
- All Figure Page
- Back to All Figure Page
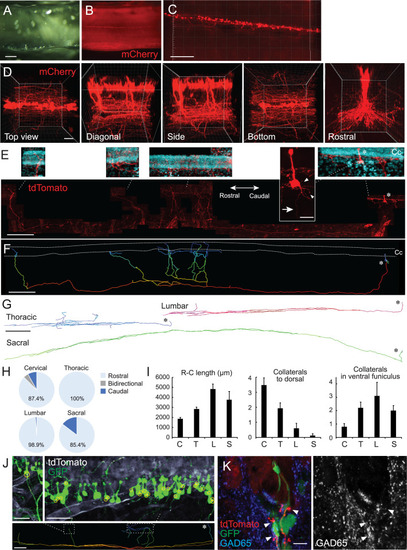
(A, B) Clearing of adeno-associated virus (AAV)-Syn-mCherry-injected cervical cord with CUBIC. Cleared cervical cord (A) and a fluorescent image (B) shown in a side view under a stereomicroscope. (C, D) Z-stack confocal images of mCherry+ CSF-cNs (C), red, and higher magnification views from the top, diagonal, side, bottom, and rostral sides (D), representing aligned soma and their ventral to rostrocaudal axon projections. (E) Representative images of a single-cell traced tdTomato+ CSF-cN and its projections (red). A side view at the cervical level of Rosa26lsl-tdTomato mice injected with a low dose of AAV-Syn-Cre. Top panels depict higher magnification views of the tdTomato+ cell and its projections around the central canal (Cc). 4′,6-diamidino-2-phenylindole (DAPI; blue). Arrow, axon; arrowheads, basal dendrites; asterisks, cell bodies. Left, rostral; right, caudal. (F) A reconstructed IMARIS image of the single-cell traced CSF-cN in (E). Dotted lines, Cc; asterisk, cell body. (G) Representative reconstructed images of single-cell traced CSF-cNs in the thoracic, lumbar, and sacral levels. Asterisks, cell bodies. (H) Pie charts representing the ratio of CSF-cNs comprising rostral, caudal, or bidirectional axon projections (cervical, n=87; thoracic, n=109; lumbar, n=95; sacral, n=41). (I) Rostrocaudal axonal lengths in the ventral funiculus and the number of collaterals projecting in dorsal and rostral directions in the ventral funiculus. Cervical (C), n=25; thoracic (T), n=28; lumbar (L), n=10; sacral (S), n=8; the mean ± standard error of the mean (SEM). (J) tdTomato+ axons of single-cell traced CSF-cNs (white) contacting onto other GFP+ CSF-cNs (green), labeled with a high-dose of AAV-Syn-EGFP injection. Contact areas are indicated in yellow circles. Images in the upper panels are of the dotted areas in the bottom IMARIS-reconstructed image. (K) tdTomato+ axons of single-cell traced CSF-cNs (red) contacting the soma of other GFP+ CSF-cNs (green) with a presynaptic marker GAD65 (blue, left; white, right; arrowheads). Scale bars, 500 µm (A, B); 200 µm (C), lower panel of (E), (F), lower panel of (J); 50 µm (D); 20 µm (upper panel of E); 500 µm (G); 50 µm (upper panels of J); 10 µm (K).
|