
Figure 4
- ID
- ZDB-FIG-230228-46
- Publication
- Nakamura et al., 2023 - Cerebrospinal fluid-contacting neuron tracing reveals structural and functional connectivity for locomotion in the mouse spinal cord
- Other Figures
- All Figure Page
- Back to All Figure Page
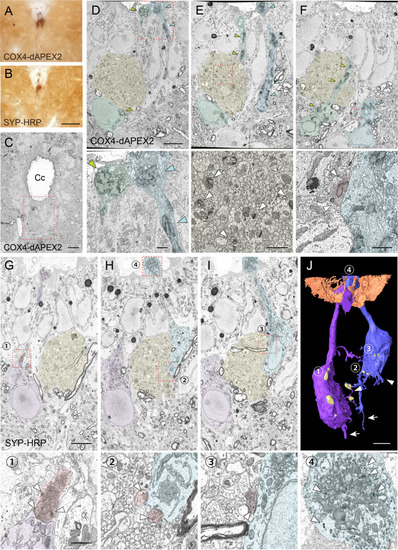
(A, B) Representative light microscopic images of 3, 3'-diaminobenzidine (DAB)-stained spinal cord sections of Pkd2l1-Cre mice with injection of adeno-associated virus (AAV)-Syn-DIO-COX4-dAPEX2 (A) or AAV-Syn-DIO-SYP-HRP (B). (C) A low-magnification electron microscopic image of the cervical cord around the central canal (Cc) in Pkd2l1-Cre mice injected with AAV-Syn-DIO-COX4-dAPEX2. The dotted area was subjected to SBF-SEM analyses and is shown in (D–F). (D–F) Representative serial (the 130th, 148th, and 186th) SBF-SEM images of the COX4-dAPEX2-labeled sample. High-magnification images of the dotted areas in the upper panels are shown in the bottom panels, which represent dendritic bulbs (D), subependymal axon bundles (E), and a synaptic contact (F) that include DAB-positive mitochondria. COX4-dAPEX2+ CSF-cNs are pseudo-colored in green and blue; the subependymal unmyelinated axon bundle in yellow; the presynaptic terminal in red. Arrowheads indicate DAB-positive mitochondria labeled with COX4-dAPEX2. (G–I) Representative serial SBF-SEM images (the 173th, 224th, and 249th) of the SYP-HRP-labeled sample in the ventral part of Cc in the cervical cord. High-magnification images of the dotted areas in the top panels are shown in the bottoms, which represent synaptic contacts (1–3), and a dendritic bulb (4) containing SYP-HRP+ vesicles. SYP-HRP+ CSF-cNs are pseudo-colored in purple and blue; the subependymal axon bundle in yellow; the presynaptic terminals in red. Arrowheads, SYP-HRP+ vesicles. (J) Three-dimensional reconstruction of SYP-HRP+ CSF-cNs and presynaptic terminals (yellow), represented in (G–I). The numbers 1–4 indicate the positions shown in (G–I). Microvilli and cilia of ependymal cells are represented in brown to show the surface of the Cc. Arrows, axons; arrowheads, basal dendrites. Scale bars, 50 µm (A, B); 10 µm (C); 5 µm (upper panels of D–J); 1 µm (bottom panels of D–I).
|