
Figure 1
- ID
- ZDB-FIG-230228-45
- Publication
- Nakamura et al., 2023 - Cerebrospinal fluid-contacting neuron tracing reveals structural and functional connectivity for locomotion in the mouse spinal cord
- Other Figures
- All Figure Page
- Back to All Figure Page
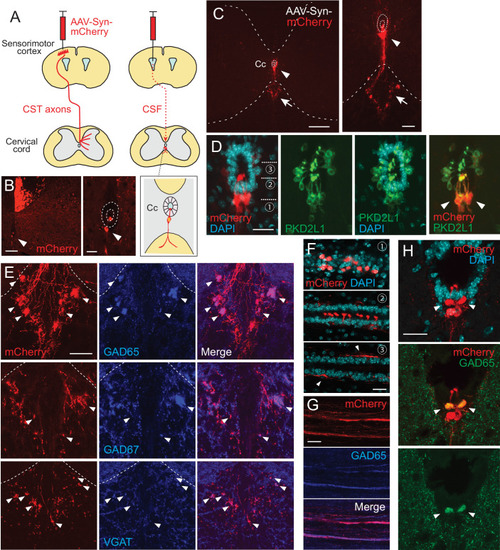
(A) Schema of AAV-Syn-mCherry injections into the sensorimotor cortex (left) or lateral ventricle (right). (B) mCherry-labeled neurons around the central canal (Cc) occasionally observed after cortical AAV injections, which were putatively labeled by AAV leaking into CSF (red, arrowhead). The right panel is a magnified view around the Cc (dotted lines). Note that abundant corticospinal tract (CST) axons are also labeled. (C) Representative transverse images of mCherry-labeled neurons around the Cc at the cervical level after an AAV injection into the lateral ventricle (red, arrowheads). The right panel is a magnified view around the Cc. Arrows represent mCherry+ fibers extending to the ventral funiculus. Dotted lines indicate Cc and the border between the gray and white matter. (D) Confocal views of mCherry-labeled neurons (red) around the Cc, co-expressing PKD2L1 (green), a marker of CSF-cNs (arrowheads). 4′,6-diamidino-2-phenylindole (DAPI), blue. (E) mCherry+ axon bundles extending into the ventral funiculus (red) with GAD65, GAD67, and VGAT signals (blue, arrowheads). Dotted lines indicate the border between the gray and white matter. (F) Horizontal views of mCherry+ CSF-cNs (red) in different planes of depths (1–3), which are indicated in (D). Confocal analyses. Arrowheads, subependymal fibers. (G) Horizontal views of mCherry+ axon bundles in the ventral funiculus (red), co-expressing GAD65 (blue). (H) Transverse images of mCherry+ axon bundles in the subependymal area, co-labeled with GAD65 (green, arrowheads). Scale bars, 100 µm (left panel of B); 25 µm (right panel of B, D, F); 200 µm (left panel of C); 50 µm (right panel of C, E, H).
|