
- Title
-
Cerebrospinal fluid-contacting neuron tracing reveals structural and functional connectivity for locomotion in the mouse spinal cord
- Authors
- Nakamura, Y., Kurabe, M., Matsumoto, M., Sato, T., Miytashita, S., Hoshina, K., Kamiya, Y., Tainaka, K., Matsuzawa, H., Ohno, N., Ueno, M.
- Source
- Full text @ Elife
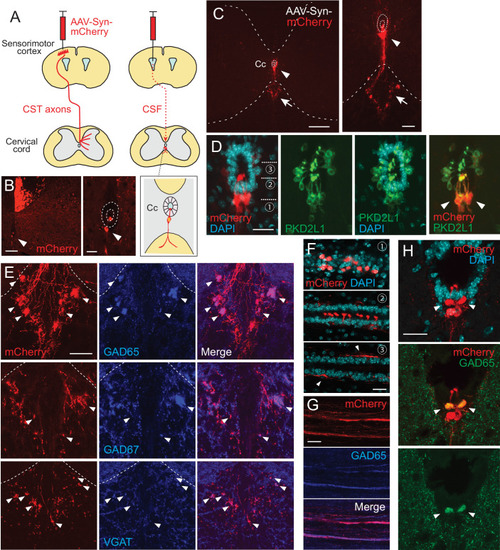
(A) Schema of AAV-Syn-mCherry injections into the sensorimotor cortex (left) or lateral ventricle (right). (B) mCherry-labeled neurons around the central canal (Cc) occasionally observed after cortical AAV injections, which were putatively labeled by AAV leaking into CSF (red, arrowhead). The right panel is a magnified view around the Cc (dotted lines). Note that abundant corticospinal tract (CST) axons are also labeled. (C) Representative transverse images of mCherry-labeled neurons around the Cc at the cervical level after an AAV injection into the lateral ventricle (red, arrowheads). The right panel is a magnified view around the Cc. Arrows represent mCherry+ fibers extending to the ventral funiculus. Dotted lines indicate Cc and the border between the gray and white matter. (D) Confocal views of mCherry-labeled neurons (red) around the Cc, co-expressing PKD2L1 (green), a marker of CSF-cNs (arrowheads). 4′,6-diamidino-2-phenylindole (DAPI), blue. (E) mCherry+ axon bundles extending into the ventral funiculus (red) with GAD65, GAD67, and VGAT signals (blue, arrowheads). Dotted lines indicate the border between the gray and white matter. (F) Horizontal views of mCherry+ CSF-cNs (red) in different planes of depths (1–3), which are indicated in (D). Confocal analyses. Arrowheads, subependymal fibers. (G) Horizontal views of mCherry+ axon bundles in the ventral funiculus (red), co-expressing GAD65 (blue). (H) Transverse images of mCherry+ axon bundles in the subependymal area, co-labeled with GAD65 (green, arrowheads). Scale bars, 100 µm (left panel of B); 25 µm (right panel of B, D, F); 200 µm (left panel of C); 50 µm (right panel of C, E, H).
|
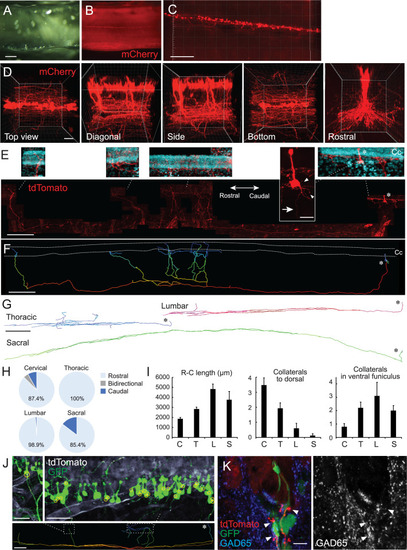
(A, B) Clearing of adeno-associated virus (AAV)-Syn-mCherry-injected cervical cord with CUBIC. Cleared cervical cord (A) and a fluorescent image (B) shown in a side view under a stereomicroscope. (C, D) Z-stack confocal images of mCherry+ CSF-cNs (C), red, and higher magnification views from the top, diagonal, side, bottom, and rostral sides (D), representing aligned soma and their ventral to rostrocaudal axon projections. (E) Representative images of a single-cell traced tdTomato+ CSF-cN and its projections (red). A side view at the cervical level of Rosa26lsl-tdTomato mice injected with a low dose of AAV-Syn-Cre. Top panels depict higher magnification views of the tdTomato+ cell and its projections around the central canal (Cc). 4′,6-diamidino-2-phenylindole (DAPI; blue). Arrow, axon; arrowheads, basal dendrites; asterisks, cell bodies. Left, rostral; right, caudal. (F) A reconstructed IMARIS image of the single-cell traced CSF-cN in (E). Dotted lines, Cc; asterisk, cell body. (G) Representative reconstructed images of single-cell traced CSF-cNs in the thoracic, lumbar, and sacral levels. Asterisks, cell bodies. (H) Pie charts representing the ratio of CSF-cNs comprising rostral, caudal, or bidirectional axon projections (cervical, n=87; thoracic, n=109; lumbar, n=95; sacral, n=41). (I) Rostrocaudal axonal lengths in the ventral funiculus and the number of collaterals projecting in dorsal and rostral directions in the ventral funiculus. Cervical (C), n=25; thoracic (T), n=28; lumbar (L), n=10; sacral (S), n=8; the mean ± standard error of the mean (SEM). (J) tdTomato+ axons of single-cell traced CSF-cNs (white) contacting onto other GFP+ CSF-cNs (green), labeled with a high-dose of AAV-Syn-EGFP injection. Contact areas are indicated in yellow circles. Images in the upper panels are of the dotted areas in the bottom IMARIS-reconstructed image. (K) tdTomato+ axons of single-cell traced CSF-cNs (red) contacting the soma of other GFP+ CSF-cNs (green) with a presynaptic marker GAD65 (blue, left; white, right; arrowheads). Scale bars, 500 µm (A, B); 200 µm (C), lower panel of (E), (F), lower panel of (J); 50 µm (D); 20 µm (upper panel of E); 500 µm (G); 50 µm (upper panels of J); 10 µm (K).
|
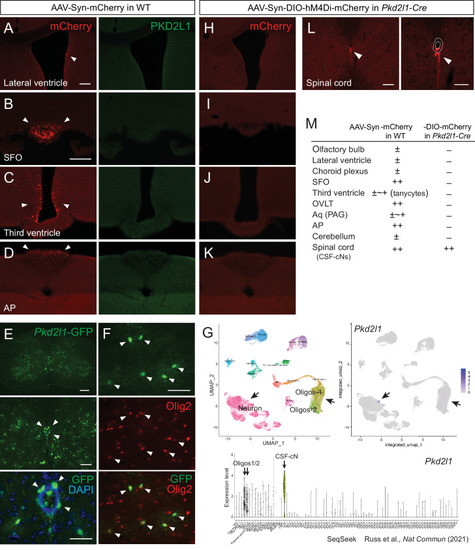
(A–D) mCherry labeled cells (red, arrowheads) in the lateral ventricle (A), SFO (B), third ventricle (C), and AP (D) following AAV-Syn-mCherry intracerebroventricular injection into wild-type (WT) mice. No PKD2L1 expression (green) was observed in these regions. (E, F) GFP+ signals in the CSF-cNs (E), green, arrowheads and Olig2+ oligodendrocytes (F), red, arrowheads in the spinal cord of an adult Pkd2l1-Cre;CAG-lcl-EGFP mouse. 4′,6-diamidino-2-phenylindole (DAPI), blue. (G) Single-cell/nucleus RNA-seq data in SeqSeek database (https://seqseek.ninds.nih.gov/home, Russ et al., 2021) represent Pkd2l1 mRNA expression in CSF-cNs and a subpopulation of oligodendrocytes. Upper panels show a uniform manifold approximation and projection (UMAP) plot of spinal cord single-cell/nucleus RNA-seq data (left), and feature plots highlight Pkd2l1 expression in spinal cells (violet, right). The bottom panel depicts violin plots representing Pkd2l1 expression levels in spinal cell types. (H–K) mCherry-labeled cells (red, arrowheads) in the lateral ventricle (H), SFO (I), third ventricle (J), AP (K), and cervical cord (L) following AAV-Syn-DIO-hM4Di-mCherry intracerebroventricular injection into Pkd2l1-Cre mice. The right image of (L) is a higher magnification view around the central canal (dotted lines). (M) Summary of AAV-Syn-mCherry and -DIO-hM4Di-mCherry-labeled cells in the brain and spinal cord of WT and Pkd2l1-Cre mice, respectively. Scale bars, 100 µm (A, B); 200, 100, 50 µm (upper to bottom in E); 50 µm (F); 100, 50 µm (left, right in L). AP, area postrema; Aq, cerebral aqueduct; OVLT, vascular organ of the lamina terminalis; PAG, periaqueductal gray; SFO, subfornical organ.
|
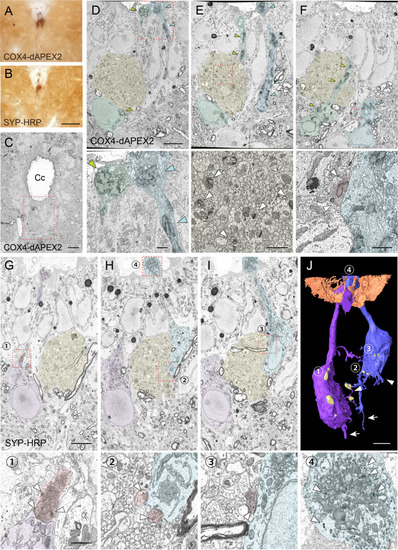
(A, B) Representative light microscopic images of 3, 3'-diaminobenzidine (DAB)-stained spinal cord sections of Pkd2l1-Cre mice with injection of adeno-associated virus (AAV)-Syn-DIO-COX4-dAPEX2 (A) or AAV-Syn-DIO-SYP-HRP (B). (C) A low-magnification electron microscopic image of the cervical cord around the central canal (Cc) in Pkd2l1-Cre mice injected with AAV-Syn-DIO-COX4-dAPEX2. The dotted area was subjected to SBF-SEM analyses and is shown in (D–F). (D–F) Representative serial (the 130th, 148th, and 186th) SBF-SEM images of the COX4-dAPEX2-labeled sample. High-magnification images of the dotted areas in the upper panels are shown in the bottom panels, which represent dendritic bulbs (D), subependymal axon bundles (E), and a synaptic contact (F) that include DAB-positive mitochondria. COX4-dAPEX2+ CSF-cNs are pseudo-colored in green and blue; the subependymal unmyelinated axon bundle in yellow; the presynaptic terminal in red. Arrowheads indicate DAB-positive mitochondria labeled with COX4-dAPEX2. (G–I) Representative serial SBF-SEM images (the 173th, 224th, and 249th) of the SYP-HRP-labeled sample in the ventral part of Cc in the cervical cord. High-magnification images of the dotted areas in the top panels are shown in the bottoms, which represent synaptic contacts (1–3), and a dendritic bulb (4) containing SYP-HRP+ vesicles. SYP-HRP+ CSF-cNs are pseudo-colored in purple and blue; the subependymal axon bundle in yellow; the presynaptic terminals in red. Arrowheads, SYP-HRP+ vesicles. (J) Three-dimensional reconstruction of SYP-HRP+ CSF-cNs and presynaptic terminals (yellow), represented in (G–I). The numbers 1–4 indicate the positions shown in (G–I). Microvilli and cilia of ependymal cells are represented in brown to show the surface of the Cc. Arrows, axons; arrowheads, basal dendrites. Scale bars, 50 µm (A, B); 10 µm (C); 5 µm (upper panels of D–J); 1 µm (bottom panels of D–I).
|
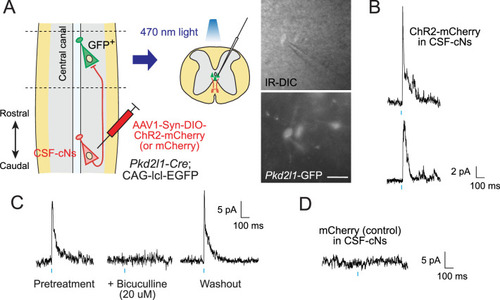
(A) Diagram of electrophysiological recording of Pkd2l1-GFP+ CSF-cNs and blue light stimulation of ChR2-mCherry+ axons of caudally located CSF-cNs in spinal slices of Pkd2l1-Cre;CAG-lcl-EGFP mice. ChR2-mCherry was introduced by local injection of adeno-associated virus (AAV)-Syn-DIO-ChR2-mCherry (or AAV-Syn-DIO- mCherry for controls) into the caudal thoracic cord. The right panels are images of patched Pkd2l1-GFP+ CSF-cNs. Scale bar, 25 µm. (B) Representative inhibitory postsynaptic current (IPSC) responses of two recorded Pkd2l1-GFP+ CSF-cNs evoked by a blue light stimulation (10 ms, blue). (C) Representative IPSCs of Pkd2l1-GFP+ CSF-cN, blocked under 20 µM bicuculline treatment. (D) No IPSCs were evoked in the control spinal cord injected with AAV-Syn-DIO-mCherry. Blue bars indicate blue light pulses.
|
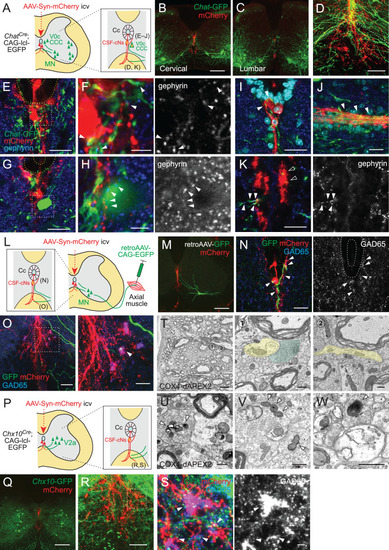
(A) Diagram of Chat-GFP+ cholinergic neurons and adeno-associated virus (AAV)-Syn-mCherry labeled CSF-cNs in ChatCre;CAG-lcl-EGFP mice. Cc, central canal; CCC, central canal cluster cells; MN, motor neuron. Image positions of (D–K) are indicated in the right panel. (B, C) Representative images of mCherry+ CSF-cNs (red) and Chat-GFP+ neurons (green) in the cervical (B) and lumbar cord (C) of ChatCre;CAG-lcl-EGFP mice. (D) A magnified image of Chat-GFP+ (green) and mCherry+ fibers (red), which are intermingled at the ventral midline and ventral funiculus of the cervical cord. The dotted line indicates the border between the gray and white matter. (E, F) Chat-GFP+ neurites (green) extend near the central canal (yellow dotted lines) (E), and those with gephyrin+ puncta (blue and white, arrowheads) are contacted by mCherry+ CSF-cN fibers (red) (F). (F) is a magnified view of the white dotted area in (E). (G, H) Chat-GFP+ interneuron (green) near the central canal (yellow dotted lines) is contacted by mCherry+ CSF-cN fibers (red) apposing gephyrin+ puncta (blue and white, arrowheads). (H) is a magnified view of the white dotted area in (G). (I, J) Chat-GFP+ neurites intermingled with the mCherry+ subependymal axon bundle (red) in the cervical cord (arrowheads). Transverse (I) and horizontal sections (J). (K) Chat-GFP+ neurites (green) are intermingled with the mCherry+ axon bundle (red) in the ventral funiculus (arrowheads), with some making contact with the gephyrin+ puncta (blue and white, closed arrowheads). (L) Diagram representing axial MNs and CSF-cNs, labeled by retroAAV-CAG-EGFP and AAV-Syn-mCherry injections into the axial muscle and lateral ventricle, respectively. Image positions of (N, O) are indicated. (M) GFP+ MN of the dorsal neck muscle (semispinalis capitis) is labeled with retroAAV-CAG-EGFP (green) and mCherry+ CSF-cNs at the cervical level. Note the GFP+ fibers extending to the central canal, ventral midline, and ventral funiculus. (N) GFP+ MN neurites extending near the central canal and are contacted by mCherry+ CSF-cN fibers with GAD65+ puncta (blue and white, arrowheads). (O) GFP+ MN neurites (green) are intermingled with the mCherry+ axon bundle (red) in the ventral funiculus with GAD65+ puncta (blue, white, arrowheads). The right panel is a magnified view of the dotted area in the left panel. (P) Diagram of Chx10-GFP+ V2a neurons and AAV-Syn-mCherry-labeled CSF-cNs in Chx10Cre;CAG-lcl-EGFP mice. Image positions of (R, S) are indicated. (Q) Chx10-GFP+ V2a neurons (green) and mCherry+ CSF-cNs (red) in the cervical cord of Chx10Cre;CAG-lcl-EGFP mice. (R, S) Chx10-GFP+ fibers (green) extending to mCherry+ fiber bundles (red) in the ventral funiculus. (S) shows a magnified view of the dotted area in (R), which consists of Chx10-GFP+ fibers contacted by mCherry+ ventral bundles with GAD65+ puncta (blue and white) (arrowheads). (T) Serial block-face scanning electron microscopy images of the ventral bundles showing COX4-dAPEX2+ presynaptic terminals of CSF-cNs (pseudo-colored in green) in contact with a COX4-dAPEX2– neurite coming from outside of the bundle (yellow). Positions 1 and 2 in the left panel are magnified in the right panels (the 80th and 139th serial images). (U–W) Transmission electron microscope images of presynaptic terminals containing COX4-dAPEX2+ mitochondria (arrowheads) contacting with COX4-dAPEX2– neurites in the bundle of ventral funiculus at the thoracic level (U, V) and subependymal area at the cervical level (W). Scale bars, 250 µm (B, C, M, Q); 50 µm (D), (K), left panel of (O), (R); 20 µm (E), (G), (I), (J), (N), right panel of (O); 5 µm (F), (H), (S), left panel of (T); 0.5 µm (right panels of T, U, V, W).
|
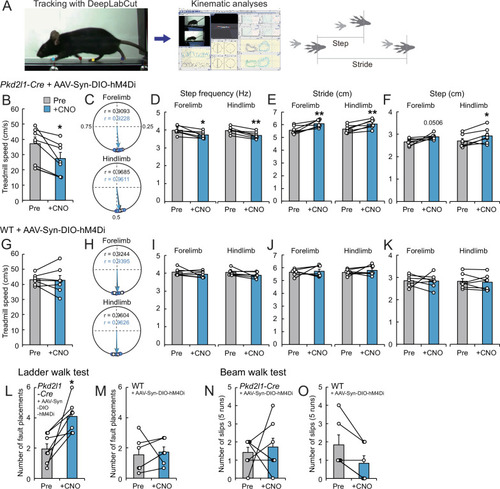
(A) The experimental system to analyze treadmill locomotion. Trajectories of fore- and hind-paw were tracked by DeepLabCut and kinematic parameters including step and stride lengths were analyzed by KinemaTracer. (B–F) Analyses of treadmill locomotion pre- and post-inactivation of hM4Di+ CSF-cNs by clozapine-N-oxide (CNO) treatment. Pkd2l1-Cre mice were intracerebroventricularly injected with adeno-associated virus (AAV)-Syn-DIO-hM4Di-mCherry to introduce hM4Di-mCherry. (B) Maximum treadmill speeds in a program increasing from 8.33 to 58.33 cm/s (5.0–35 m/min). (C–F) Circular phase plots representing phase values of the left fore- and hind-paw contacts between two right paw contacts and r (C), step frequency (D), stride lengths (E), and step lengths (F) of the left fore- and hindlimbs at a speed of 23.3 cm/s (14 m/min). CNO-treated groups are represented in blue. (G–K) Analyses of treadmill locomotion of AAV-Syn-DIO-hM4Di-mCherry-injected wild-type (WT) mice pre- and post-CNO treatment. Maximum treadmill speeds (G), circular phase plots (H), step frequency (I), stride lengths (J), and step lengths (K) of the left fore- and hindlimbs. (L, M) Average number of fault placements in the ladder walk test pre- and post-CNO treatment in AAV-Syn-DIO-hM4Di-mCherry-injected Pkd2l1-Cre (L) and WT mice (M). (N, O) The number of slips in five runs of the beam walk test pre- and post-CNO treatment in AAV-Syn-DIO-hM4Di-mCherry-injected Pkd2l1-Cre (N) and WT mice (O). Paired t-test (B,D–F, G, I–M), Wilcoxon matched-pairs signed rank test (N, O); *p<0.05, ** p<0.01; the mean ± standard error of the mean (SEM); n=7 (B–L, N), n=6 (M, O).
|