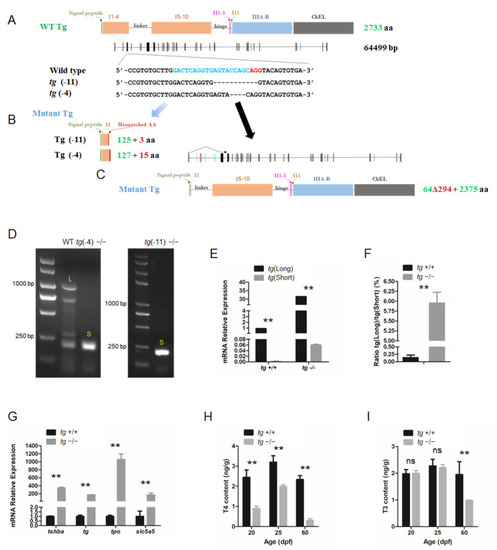
Generation of tg mutant zebrafish. (A) Schematic illustration representing the zebrafish Tg protein, the genomic structure of tg, and the CRISPR target site on exon 4. Sequencing of the tg CRISPR target site in wild type, tg (-4) mutant, and tg (-11) mutant zebrafish lines are shown in the lower panel. (B) The predicted truncated Tg proteins resulting from premature translational terminations are shown. (C) Proteins resulting from the alternative short transcript are shown. (D) The alternative short transcripts can be amplified in wild-type fish and tg mutants. The long transcripts were indicated by the letter L. The short transcripts were indicated by the letter S. (E) Quantification of the expression levels of the tg full-length transcript and short transcript in tg mutants and their wild-type siblings. (F) Ratio of the tg full-length transcript and short transcript expression in tg mutants and their wild-type siblings. (G) Quantitative RT-PCR analyses of tshba, tg, tpo, and slc5a5 expression levels in tg mutants and their wild-type siblings at 5 dpf. (H) Whole-body T4 contents of tg mutants and their wild-type siblings at the 20, 25, and 60 dpf stages. (I) Whole-body T3 contents of tg mutants and their wild-type siblings at the 20, 25, and 60 dpf stages.** p < 0.01, ns: No significance.
|
