
Figure 2
- ID
- ZDB-FIG-210902-184
- Publication
- Song et al., 2021 - Functions of the Thyroid-Stimulating Hormone on Key Developmental Features Revealed in a Series of Zebrafish Dyshormonogenesis Models
- Other Figures
- All Figure Page
- Back to All Figure Page
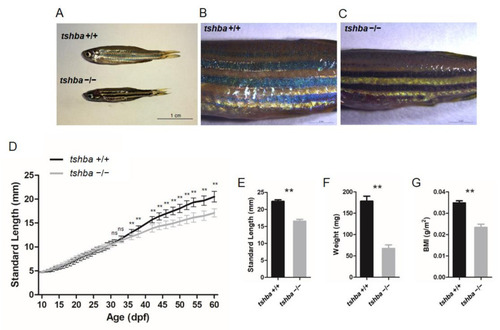
Somatic growth features of the tshba mutant fish and control wild-type siblings. (A) Wild-type control fish and tshba mutant zebrafish at 2 mpf. (B,C) Pigment pattern of wild-type control fish (B) and tshba mutant fish (C) at 2 mpf. (D) Curves of the somatic growth of wild-type control fish and tshba mutant fish. Means of standard length (SL) are presented as the growth curve. Measurements were performed with wild-type fish (n = 10) and tshba mutants (n = 10). Significantly distinguishable differences beginning at 36 dpf. (E–G) SL (E), whole-body weight (F), and body mass index (G) of tshba mutant fish and their wild-type siblings at 2 mpf. Measurements were taken of wild-type fish (n = 12) and tshba mutant fish (n = 10). ** p < 0.01. |
| Fish: | |
|---|---|
| Observed In: | |
| Stage: | Days 45-89 |